Nov
19
2018
--

Installing and Configuring JIT in PostgreSQL 11

JIT with PostgreSQL

JIT in PostgreSQLJust-in-time (JIT in PostgreSQL) compilation of SQL statements is one of the highlighted features in PostgreSQL 11. There is great excitement in the community because of the many claims of up to a 30% jump in performance. Not all queries and workloads get the benefit of JIT compilation. So you may want to test your workload against this new feature.

However, It is important to have a general understanding of what it does and where we can expect the performance gains. Installing PostgreSQL 11 with the new JIT compilation feature requires few extra steps and packages. Taking the time and effort to figure out how to do this shouldn’t be a reason to shy away from trying these cutting-edge features and testing a workload against the JIT feature. This blog post is for those who want to try it.

What is JIT and What it does in PostgreSQL

Normal SQL execution in any DBMS software is similar to what an interpreted language does to the source code. No machine code gets generated out of your SQL statement. But we all know that how dramatic the performance gains can be from a JIT compilation and execution of the machine code it generates. We saw the magic Google V8 engine did to JavaScript language. The quest for doing a similar thing with SQL statement was there for quite some time. But it is a challenging task.

It is challenging because we don’t have the source code (SQL statement) ready within the PostgreSQL server. The source code that needs to undergo JIT need to come from client connections and there could be expressions/functions with a different number of arguments, and it may be dealing with tables of different number and type of columns.

Generally, a computer program won’t get modified at this level while it is running, so branching-predictions are possible. The unpredictability and dynamic nature of SQL statements coming from client connections and hitting the database from time-to-time give no scope for doing advance prediction or compilation in advance. That means the JIT compiler should kick in every time the database gets an SQL statement. For this reason, PostgreSQL needs the help of compiler infrastructure like LLVM  continuously available behind. Even though there were a couple of other options, the main developer of this feature (Andres Freund) had a strong reason why LLVM was the right choice.

. In PostgreSQL 11, the JIT feature currently does:

  1. Accelerating expression evaluation: Expressions in  WHERE clauses, target lists, aggregates and projections
  2. Tuple deforming: Converting on-disk image to corresponding memory representation.
  3. In-lining: bodies of small custom functions, operators and user-defined data types are inline-ed into the expressions using them
  4. You can use compiler optimizations provided by LLVM for preparing optimized machine code.

In this blog, we are going to see how to install PostgreSQL with JIT. Just like regular PostgreSQL installations, we have two options:

  1. Get PostgreSQL from the packages in the PGDG repository
  2. Build PostgreSQL from source

Option 1. Install from PGDG repository.

Compiling from source requires us to install all compilers and tools. We might want to avoid this for various reasons. Installing packages from a PGDG repository is straightforward. On production systems or a container, you might want to install only the bare minimum required packages. Additional packages you don’t really use are always a security concern. Distributions like Ubuntu provide more recent versions of libraries and tool-sets in their default repos. However, distributions like CentOS / RHEL are quite conservative — their priority is stability and proven servers rather than cutting-edge features. So In this section of the post is mostly relevant for CentOS7/RHEL 7.

Here are the steps for the bare minimum installation of PostgreSQL with JIT feature on CentOS7

Step 1. Install PGDG repo and Install PostgreSQL server package.

This is usually the bare minimum installation if we don’t need the JIT feature.

sudo yum install https://download.postgresql.org/pub/repos/yum/11/redhat/rhel-7-x86_64/pgdg-centos11-11-2.noarch.rpm
sudo yum install postgresql11-server

At this stage, we can initialize the data directory and start the service if we don’t need JIT:

sudo /usr/pgsql-11/bin/postgresql*-setup initdb
sudo systemctl start postgresql-11

Step 2. Install EPEL repository

sudo yum install epel-release

Step 3. Install package for PostgreSQL with llvmjit

sudo yum install postgresql11-llvmjit

Since we have already added the EPEL repository, now the dependancy can be resolved by YUM and it can pull and install the necessary package from EPEL. Installation message contains the necessary packages.

...
Installing:
postgresql11-llvmjit      x86_64     11.1-1PGDG.rhel7     pgdg11    9.0 M
Installing for dependencies:
llvm5.0                   x86_64     5.0.1-7.el7          epel      2.6 M
llvm5.0-libs              x86_64     5.0.1-7.el7          epel      13 M
...

As we can see, there are two packages: llvm5.0 and llvm5.0-libs get installed.

Note for Ubuntu users:

As we already mentioned, Repositories of recent versions of Ubuntu contains recent versions of LLVM libraries. For example, Ubuntu 16.04 LTS repo contains libllvm6.0 by default. Moreover, PostgreSQL server package is not divided to have a separate package for jit related files. So default installation of PostgreSQL 11 can get you JIT feature also.

wget --quiet -O - https://www.postgresql.org/media/keys/ACCC4CF8.asc | sudo apt-key add -
sudo sh -c 'echo "deb http://apt.postgresql.org/pub/repos/apt/ $(lsb_release -cs)-pgdg main" > /etc/apt/sources.list.d/pgdg.list'
sudo apt install postgresql-11

Option 2. Building from Source

The primary means of distributing PostgreSQL is the source code. Building a minimal PostgreSQL instance requires just a C compiler. But building JIT options requires a few more things. One of the challenges you can run into is different errors during the build process due to older versions of LLVM and Clang present in the system.

Step 1. Download PostgreSQL source tarball and unpack

Tarballs are available in the repository. We can grab and unpack the latest:

curl -LO https://ftp.postgresql.org/pub/source/v11.0/postgresql-11.0.tar.bz2
tar -xvf postgresql-11.0.tar.bz2

Step 2.  Get SCL Repository and Install toolset

Latest versions of LLVM, CLang and GCC are available in SCL. We can get everything in a stretch:

sudo yum install centos-release-scl
sudo yum install llvm-toolset-7 llvm-toolset-7-llvm-devel.x86_64

Now either you can set or edit your PATH to have all new tools in PATH. I would prefer to put that into my profile file:

PATH=/opt/rh/devtoolset-7/root/usr/bin/:/opt/rh/llvm-toolset-7/root/usr/bin/:$PATH

Alternatively, we can open a shell with SCL enabled:

scl enable devtoolset-7 llvm-toolset-7 bash

We should attempt to compile the source from a shell with all these paths set.

Step 3. Install Additional libraries/tools

Based on the configuration options you want, this list may change. Consider this as a sample for demonstration purposes:

sudo yum install  readline-devel zlib-devel libxml2-devel openssl-devel

Step 4. Configure with –with-llvm option and make

Now we should be able to configure and make with our preferred options. The JIT feature will be available if the 

--with-llvm

 option is specified. For this demonstration, I am using an installation directory with my home (/home/postgres/pg11):

./configure --prefix=/home/postgres/pg11 --with-openssl --with-libxml --with-zlib --with-llvm
make
make install

Enabling JIT

You may observe that there is a new directory under the PostgreSQL’s lib folder with name

bit code

Which contains lots of files with .bc extension these are pre-generated bytecodes for LLVM for facilitating features like in-lining.

By default, the JIT feature is disabled in PostgreSQL 11. If you want to test it, you may have to enable the parameter

jit

:

postgres=# ALTER SYSTEM SET jit=on;
ALTER SYSTEM
postgres=# select pg_reload_conf();
 pg_reload_conf
----------------
 t
(1 row)
postgres=# show jit;
 jit
-----
 on
(1 row)

By default, most of the simple queries won’t use JIT because of the cost. The cost is high when JIT kicks in. In case we want to test if JIT is properly configured, we can lie to PostgreSQL that that cost is very low by adjusting the parameter value. However, we should keep in mind that we are accepting negative performance gains. Let me show a quick example:

postgres=# SET jit_above_cost=5;
SET
postgres=# create table t1 (id int);
CREATE TABLE
postgres=# insert into t1 (SELECT (random()*100)::int FROM generate_series(1,800000) as g);
INSERT 0 800000
postgres=# analyze t1;
ANALYZE
postgres=# explain select sum(id) from t1;
                                     QUERY PLAN
-------------------------------------------------------------------------------------
 Finalize Aggregate  (cost=8706.88..8706.89 rows=1 width=8)
   ->  Gather  (cost=8706.67..8706.88 rows=2 width=8)
         Workers Planned: 2
         ->  Partial Aggregate  (cost=7706.67..7706.68 rows=1 width=8)
               ->  Parallel Seq Scan on t1  (cost=0.00..6873.33 rows=333333 width=4)
 JIT:
   Functions: 6
   Options: Inlining false, Optimization false, Expressions true, Deforming true
(8 rows)

As we can see in the above example, a separate JIT section comes up in the explain plan.

We expect JIT compilation to make a difference in complex analytical queries because the overhead in JIT compilation gets compensated only if the code runs for the duration. Here is a simple aggregate query for demonstration. (I know this is not a complex query, and not the perfect example for demonstrating JIT feature):

postgres=# EXPLAIN ANALYZE SELECT COMPANY_ID,
      SUM(SHARES) TOT_SHARES,
      SUM(SHARES* RATE) TOT_INVEST,
      MIN(SHARES* RATE) MIN_TRADE,
      MAX(SHARES* RATE) MAX_TRADE,
      SUM(SHARES* RATE * 0.002) BROKERAGE
FROM TRADING
GROUP BY COMPANY_ID;
                                                                       QUERY PLAN
---------------------------------------------------------------------------------------------------------------------------------------------------------
 Finalize GroupAggregate  (cost=757298.72..758741.91 rows=5005 width=138) (actual time=16992.290..17011.395 rows=5000 loops=1)
   Group Key: company_id
   ->  Gather Merge  (cost=757298.72..758466.64 rows=10010 width=138) (actual time=16992.270..16996.919 rows=15000 loops=1)
         Workers Planned: 2
         Workers Launched: 2
         ->  Sort  (cost=756298.70..756311.21 rows=5005 width=138) (actual time=16983.900..16984.356 rows=5000 loops=3)
               Sort Key: company_id
               Sort Method: quicksort  Memory: 1521kB
               Worker 0:  Sort Method: quicksort  Memory: 1521kB
               Worker 1:  Sort Method: quicksort  Memory: 1521kB
               ->  Partial HashAggregate  (cost=755916.09..755991.16 rows=5005 width=138) (actual time=16975.997..16981.354 rows=5000 loops=3)
                     Group Key: company_id
                     ->  Parallel Seq Scan on trading  (cost=0.00..287163.65 rows=12500065 width=12) (actual time=0.032..1075.833 rows=10000000 loops=3)
 Planning Time: 0.073 ms
 Execution Time: 17013.116 ms
(15 rows)

We can switch on the JIT parameter at the session level and retry the same query:

postgres=# SET JIT=ON;
SET
postgres=# EXPLAIN ANALYZE SELECT COMPANY_ID,
      SUM(SHARES) TOT_SHARES,
      SUM(SHARES* RATE) TOT_INVEST,
      MIN(SHARES* RATE) MIN_TRADE,
      MAX(SHARES* RATE) MAX_TRADE,
      SUM(SHARES* RATE * 0.002) BROKERAGE
FROM TRADING
GROUP BY COMPANY_ID;
                                                                       QUERY PLAN
---------------------------------------------------------------------------------------------------------------------------------------------------------
 Finalize GroupAggregate  (cost=757298.72..758741.91 rows=5005 width=138) (actual time=15672.809..15690.901 rows=5000 loops=1)
   Group Key: company_id
   ->  Gather Merge  (cost=757298.72..758466.64 rows=10010 width=138) (actual time=15672.781..15678.736 rows=15000 loops=1)
         Workers Planned: 2
         Workers Launched: 2
         ->  Sort  (cost=756298.70..756311.21 rows=5005 width=138) (actual time=15661.144..15661.638 rows=5000 loops=3)
               Sort Key: company_id
               Sort Method: quicksort  Memory: 1521kB
               Worker 0:  Sort Method: quicksort  Memory: 1521kB
               Worker 1:  Sort Method: quicksort  Memory: 1521kB
               ->  Partial HashAggregate  (cost=755916.09..755991.16 rows=5005 width=138) (actual time=15653.390..15658.581 rows=5000 loops=3)
                     Group Key: company_id
                     ->  Parallel Seq Scan on trading  (cost=0.00..287163.65 rows=12500065 width=12) (actual time=0.039..1084.820 rows=10000000 loops=3)
 Planning Time: 0.072 ms
 JIT:
   Functions: 28
   Options: Inlining true, Optimization true, Expressions true, Deforming true
   Timing: Generation 5.844 ms, Inlining 137.226 ms, Optimization 201.152 ms, Emission 125.022 ms, Total 469.244 ms
 Execution Time: 15696.092 ms
(19 rows)

Here we see a 7.7% improvement in performance. I executed this several times and found that the performance gain is consistently 7-8% for this simple query (which takes 15 seconds to execute). The gains are higher for queries with more calculations/expressions.

Summary

It is fairly simple to install and configure JIT with PostgreSQL as demonstrated above. One point we would like to highlight is that installing JIT packages and enabling the JIT feature can be done online while the database is up and running. This is because all JIT related parameters are dynamic in nature. Parameter changes can be loaded a SIGHUP signal or

SELECT pg_reload_conf()

 by the superuser. If it is not helping our workload, we can turn it off anytime. Nothing stops you from trying it in a non-production environment. We might not see a gain in small and simple queries that take less time for execution because the overhead in doing the JIT compilation can become more than executing the SQL statement. But we should expect a good gain in OLAP workload with complex queries that run for a longer duration.

Sep
11
2018
--

How To Deploy PMM on Linode With StackScripts

rebuiild from a StackScript

In my previous blog post, I showed how to deploy Percona Monitoring and Management (PMM) on Linode manually. It is pretty simple, but with a little coding it can be done even more easily using StackScripts

Here’s how:

1. Click on the “Add a Linode” and pick a Linode type you want to deploy.

2. Click on the deployed Linode and then click on the “Rebuild” Link

Rebuild the Linode

3. Click on Deploy Using StackScripts

Deploy using StackScripts

4. On the resulting page search for “PMM” and pick PMMServer from PerconaLab.

Choose PMMServer from PerconaLab

5. Provide the host name for new Linode, pick the root password and click on “Rebuild”

6. Boot the server.

boot the server

7.  You’re done. Wait for about 5 minutes for the installation to complete, then you can see PMM interface by going to this Linode IP

view PMM on Linode IP

If you think that a manual deployment with StackScripts is not much less hassle than doing it manually, you’re right. The real benefit comes with using Linode API for deployment.

There are multiple way to access this API, though for basic scripting I prefer the linode-cli tool for using the Linode API from the command line.

With linode-cli  you can deploy your PMM Server on Linode using this one liner:

linode-cli linodes create --label pmm-test  --root_pass MyRootPassword123 --stackscript_id 338458  --stackscript_data '{"hostname": "pmm-test"}'

Summary

As you can see, with Linode StackScripts you can get going with Percona Monitoring and Management on Linode in no time, especially if you chose to use the Linode API.

You might also like:

Here’s an overview from the Percona Monitoring and Management manual on deploying PMM. If you are new to PMM and would like to know more, you will find lots of resources on this site including my webinar MySQL Troubleshooting and Performance Optimization with PMM.

The post How To Deploy PMM on Linode With StackScripts appeared first on Percona Database Performance Blog.

Aug
06
2018
--

Webinar Tues 8/14: Utilizing ProxySQL for Connection Pooling in PHP

ProxySQL for connection pooling

ProxySQL for connection poolingPlease join Percona’s Architect, Tibi Köröcz as he presents Utilizing ProxySQL for Connection Pooling in PHP on Tuesday August 14, 2018, at 8:00 am PDT (UTC-7) / 11:00 am EDT (UTC-4).


ProxySQL is a very powerful tool, with extended capabilities. This presentation will demonstrate how to use ProxySQL to gain functionality (seamless database backend switch) and correct problems (applications missing connection pooling).

The presentation will be a real-life study on how we use ProxySQL for connection pooling, database failover and load balancing the communication between our (third party) PHP-application and our master-master MySQL-cluster.
Also, we will show monitoring and statistics using Percona Monitoring and Management (PMM).

Register Now!

Tibor Köröcz

Architect

ProxySQL for Connection Pooling

Tibi joined Percona in 2015 as a Consultant. Before joining Percona, among many other things, he worked at the world’s largest car hire booking service as a Senior Database Engineer. He enjoys trying and working with the latest technologies and applications which can help or work with MySQL together. In his spare time he likes to spend time with his friends, travel around the world and play ultimate frisbee.


The post Webinar Tues 8/14: Utilizing ProxySQL for Connection Pooling in PHP appeared first on Percona Database Performance Blog.

Jun
19
2018
--

Webinar Weds 20/6: Percona XtraDB Cluster 5.7 Tutorial Part 2

webinar Percona XtraDB Cluster

Including setting up Percona XtraDB Cluster with ProxySQL and PMM

webinar Percona XtraDB ClusterPlease join Percona’s Architect, Tibi Köröcz as he presents Percona XtraDB Cluster 5.7 Tutorial Part 2 on Wednesday, June 20th, 2018, at 7:00 am PDT (UTC-7) / 10:00 am EDT (UTC-4).


Never used Percona XtraDB Cluster before? This is the webinar for you! In this 45-minute webinar, we will introduce you to a fully functional Percona XtraDB Cluster.

This webinar will show you how to install Percona XtraDB Cluster with ProxySQL, and monitor it with Percona Monitoring and Management (PMM).

We will also cover topics like bootstrap, IST, SST, certification, common-failure situations and online schema changes.

After this webinar, you will have enough knowledge to set up a working Percona XtraDB Cluster with ProxySQL, in order to meet your high availability requirements.

You can see part one of this series here: Percona XtraDB Cluster 5.7 Tutorial Part 1

Register Now!

Tibor Köröcz

Architect

ProxySQL for Connection Pooling

Tibi joined Percona in 2015 as a Consultant. Before joining Percona, among many other things, he worked at the world’s largest car hire booking service as a Senior Database Engineer. He enjoys trying and working with the latest technologies and applications which can help or work with MySQL together. In his spare time he likes to spend time with his friends, travel around the world and play ultimate frisbee.


The post Webinar Weds 20/6: Percona XtraDB Cluster 5.7 Tutorial Part 2 appeared first on Percona Database Performance Blog.

May
29
2018
--

Deploying PMM on DigitalOcean

Log in to DigitalOcean panel and click "Create Droplet."

It’s very easy to install Percona Monitoring and Management (PMM) on DigitalOcean. If you’ve never used DigitalOcean before, you will find that it is user-friendly and not very expensive. For $5/month you can easily host your PMM on it, letting you monitor your simple infrastructure or try out PMM before implementing it to monitor your production environments.

Let’s prepare the DigitalOcean instance

Log in to DigitalOcean (DO) control panel and click “Create Droplet.”

Log in to DigitalOcean panel and click "Create Droplet."

Thanks to DO you can skip the boring OS setup and save time by using the Docker “One click app” in DO and the Docker image from PMM.

Create Droplet on DigitalOcean

Note: After clicking on “Docker…” choose an instance size that accommodates your budget – PMM can run on as little as the 1GB 1vCPU instance!

Choose Droplet Size

Note: Scroll again!

Next step – select a nearby region

Since the next Percona Live Europe, 2018 will be in Frankfurt (https://www.percona.com/blog/2018/04/05/percona-live-europe-2018-save-the-date/ ) for me the location choice is obvious.

Choose DigitalOcean datacenter region

The final step in this section is ‘Set Hostname’

I recommend you add ‘pmm-server-‘ at the beginning so that you can easily find it in your control panel. The name in my case is ‘pmm-server-docker-s-1vcpu-1gb-fra1-01’ and I’ll use it later in this tutorial.

Finalize and create Droplet hostname

Click “Create” and wait a while.You can follow the process on the dashboard:

Creating the instance of DigitalOcean Droplet

When the Droplet is created, you’ll get an email with your login details.

The next step is ‘Set up PMM into the Droplet’

SSH to the server, change the password, and let’s prepare to install the PMM server.

==================
random@random-vb:~$ ssh root@X.X.X.X
...
"ufw" has been enabled. All ports except 22 (SSH), 80 (http) and 443 (https)
have been blocked by default.
...
Changing password for root.
(current) UNIX password:
Enter new UNIX password:
Retype new UNIX password:
root@pmm-server-docker-s-1vcpu-1gb-fra1-01:~#
====================

Note the output for the first login. You are getting Ubuntu 16.04 with pre-installed Docker.

The instructions for installing PMM are very simple. You can read them at https://www.percona.com/doc/percona-monitoring-and-management/deploy/server/docker.html

1) Pull the latest version from Docker Hub:

docker pull percona/pmm-server:latest

Wait for some time (this depends on your internet connection)

2) Create a container for persistent PMM data

docker create
-v /opt/prometheus/data
-v /opt/consul-data
-v /var/lib/mysql
-v /var/lib/grafana
--name pmm-data
percona/pmm-server:latest /bin/true

3) Create and launch PMM Server in one command

docker run -d
-p 80:80
--volumes-from pmm-data
--name pmm-server
--restart always
percona/pmm-server:latest

Just to confirm that your containers are available, go ahead and run “docker ps.” You’ll see something like this:

root@pmm-server-docker-s-1vcpu-1gb-fra1-01:~# docker ps
CONTAINER ID IMAGE COMMAND CREATED STATUS PORTS NAMES
5513858041f7 percona/pmm-server:latest "/opt/entrypoint.sh" 2 minutes ago Up 2 minutes 0.0.0.0:80->80/tcp, 443/tcp pmm-server

That’s all! Congratulations! Your PMM server is running.

If you open the IP of your server in the browser, you’ll see something like this:

PMM running in DigitalOcean Droplet instance

There you can see that PMM has already started monitoring itself.

Now you need to install PMM client on your database server and configure it, instructions for this are at https://www.percona.com/doc/percona-monitoring-and-management/deploy/client/index.html

Please note, if you also use DO for the database server by external IP, you’ll probably face “the firewall problem.” In this case, you need to open ports using the “ufw” tool. (See the welcome message from Digital Ocean). For testing purposes, you can use

ufw allow 42000:42999/tcp

To open only pmm-client related ports, follow https://www.percona.com/doc/percona-monitoring-and-management/glossary.terminology.html#term-ports  To run ufw, you need to use the terminal, and you can find more information about ufw at https://www.digitalocean.com/community/tutorials/ufw-essentials-common-firewall-rules-and-commands  Once you have opened up the ports, PMM should now work correctly for this setup.

Final recommendation: Depending on your load you may need to monitor your System Overview dashboard which you’ll find at http://X.X.X.X/graph/somesymbols/system-overview

If you are out of space, upgrade your DO Droplet.

The post Deploying PMM on DigitalOcean appeared first on Percona Database Performance Blog.

May
25
2018
--

Webinar Tues, 5/29: MySQL, Percona XtraDB Cluster, ProxySQL, Kubernetes: How they work together

Please join Percona’s Principal Architect Alex Rubin as he presents MySQL, Percona XtraDB Cluster, ProxySQL, Kubernetes: How they work together to give you a highly available cluster database environment on Tuesday, May 29th at 7:00 AM PDT (UTC-7) / 10:00 AM EDT (UTC-4).


In this webinar, Alex will discuss how to deploy a highly available MySQL database environment on Kubernetes/Openshift using Percona XtraDB Cluster (PXC) together with MySQL Proxy to implement read/write splitting.

If you have never used Kubernetes and Openshift, or never used PXC / MySQL Proxy, Alex will do a quick introduction to these technologies. There will also be a demo where Alex sets up a PXC cluster with ProxySQL in Openshift Origin and tries to break it.

By the end of this webinar you will have a better understanding of:

  • How to deploy Percona XtraDB Cluster with ProxySQL for HA solutions
  • How to leverage Kubernetes/Openshift in your environments
  • How to troubleshoot performance issues

Register for the webinar

Alexander Rubin, Principal Consultant

Alexander RubinAlexander joined Percona in 2013. Alexander worked with MySQL since 2000 as DBA and Application Developer. Before joining Percona he was doing MySQL consulting as a principal consultant for over 7 years (started with MySQL AB in 2006, then Sun Microsystems and then Oracle). He helped many customers design large, scalable and highly available MySQL systems and optimize MySQL performance. Alexander also helped customers design Big Data stores with Apache Hadoop and related technologies.

The post Webinar Tues, 5/29: MySQL, Percona XtraDB Cluster, ProxySQL, Kubernetes: How they work together appeared first on Percona Database Performance Blog.

May
24
2018
--

Using dbdeployer to manage MySQL, Percona Server and MariaDB sandboxes

dbdeployer by Giuseppe Maxia

Some years ago, Peter Z wrote a blogpost about using MySQL Sandbox to deploy multiple server versions. Last February, Giuseppe  introduced us to its successor: dbdeployer. In this blogpost we will demonstrate how to use it. There is a lot of information in Giuseppe’s post, so head there if you want a deeper dive.

First step is to install it, which is really easy to do now since it’s developed in Go, and standalone executables are provided. You can get the latest version here.

shell> wget https://github.com/datacharmer/dbdeployer/releases/download/1.5.0/dbdeployer-1.5.0.linux.tar.gz
shell> tar xzf dbdeployer-1.5.0.linux.tar.gz
shell> mv dbdeployer-1.5.0.linux ~/bin/dbdeployer

If you have your ~/bin/ directory in the path, you should now be able to run dbdeployer commands.

dbdeployer by Giuseppe Maxia

Let’s start with deploying a latest version vanilla MySQL sandbox.

In the Support Team, we extensively use MySQL Sandbox (the predecessor to dbdeployer) to easily run different flavours and versions of MySQL so that we can test with the same versions our customers present us with. We store MySQL binaries in /opt/, so we can all share them and avoid wasting disk space on duplicated binaries.

The first step to using dbdeployer is getting the binary we want to run, and then unpacking it into the binaries directory.

shell> wget https://dev.mysql.com/get/Downloads/MySQL-8.0/mysql-8.0.11-linux-glibc2.12-x86_64.tar.gz
shell> dbdeployer --sandbox-binary=/opt/mysql/ unpack mysql-8.0.11-linux-glibc2.12-x86_64.tar.gz

This command will extract and move the files to the appropriate directory, which in this case is under /opt/mysql/ as overridden with the --sandbox-binary argument, so we can use them with the deploy command.

Standalone

To create a new standalone MySQL sandbox with the newly extracted binary, we can use the following command.

shell> dbdeployer --sandbox-binary=/opt/mysql/ deploy single 8.0.11
Creating directory /home/vagrant/sandboxes
Database installed in $HOME/sandboxes/msb_8_0_11
run 'dbdeployer usage single' for basic instructions'
.. sandbox server started

You can read the dbdeployer usage output to have even more information on how the tool works. Next, let’s connect to it.

shell> cd sandboxes/msb_8_0_11/
shell> ./use
Welcome to the MySQL monitor.  Commands end with ; or g.
Your MySQL connection id is 9
Server version: 8.0.11 MySQL Community Server - GPL
Copyright (c) 2000, 2018, Oracle and/or its affiliates. All rights reserved.
Oracle is a registered trademark of Oracle Corporation and/or its
affiliates. Other names may be trademarks of their respective
owners.
Type 'help;' or 'h' for help. Type 'c' to clear the current input statement.
mysql [localhost] {msandbox} ((none)) > select @@version, @@port;
+-----------+--------+
| @@version | @@port |
+-----------+--------+
| 8.0.11    | 8011 |
+-----------+--------+
1 row in set (0.00 sec)

And that was it! When creating the new instance, dbdeployer will try to use the same port as the version numbers concatenated. If that port is in use, it will try another one, or we can manually override it with the --port argument.

Replication

We can also easily setup a replication environment with just one command.

shell> dbdeployer --sandbox-binary=/opt/mariadb/ deploy replication 10.2.15
Installing and starting master
. sandbox server started
Installing and starting slave1
. sandbox server started
Installing and starting slave2
. sandbox server started
$HOME/sandboxes/rsandbox_10_2_15/initialize_slaves
initializing slave 1
initializing slave 2
Replication directory installed in $HOME/sandboxes/rsandbox_10_2_15
run 'dbdeployer usage multiple' for basic instructions'

Again, you should run the recommended command to get more insight into what can be done. We can use the ./m script to connect to the master, and ./s1 to connect to the first slave. The ./use_all* scripts can come in handy to run commands in many servers at a time.

Multiple sandboxes

Finally, we will see how to create multiple sandboxes with the same version at the same time.

shell> dbdeployer --sandbox-binary=/opt/percona_server/ deploy multiple 5.7.21
Installing and starting node 1
. sandbox server started
Installing and starting node 2
. sandbox server started
Installing and starting node 3
. sandbox server started
multiple directory installed in $HOME/sandboxes/multi_msb_5_7_21
run 'dbdeployer usage multiple' for basic instructions'

This could be useful for setting up environments that are not already covered by the tool, like Galera clusters or semi-sync replication. With this approach, we will at least have a base to start from, and then can use our own custom scripts. dbdeployer now has templates, which would allow extending functionality to support this, if needed. I have not yet tried to do so, but sounds like an interesting project for the future! Let me know if you would be interested in reading more about it.

The post Using dbdeployer to manage MySQL, Percona Server and MariaDB sandboxes appeared first on Percona Database Performance Blog.

May
24
2018
--

Setting up PMM on Google Compute Engine in 15 minutes or less

Percona Monitoring and Management on Google Compute Engine

In this blog post, I will show you how easy it is to set up a Percona Monitoring and Management server on Google Compute Engine from the command line.

First off you will need to have a Google account and install the Cloud SDK tool. You need to create a GCP (Google Cloud Platform) project and enable billing to proceed. This blog assumes you are able to authenticate and SSH into instances from the command line.

Here are the steps to install PMM server in Google Cloud Platform.

1) Create the Compute engine instance with the following command. The example creates an Ubuntu Xenial 16.04 LTS compute instance in the us-west1-b zone with a 100GB persistent disk. For production systems it would be best to use a 500GB disk instead (size=500GB). This should be enough for default data retention settings, although your needs may vary.

jerichorivera@percona-support:~/GCE$ gcloud compute instances create pmm-server --tags pmmserver --image-family ubuntu-1604-lts --image-project ubuntu-os-cloud --machine-type n1-standard-4 --zone us-west1-b --create-disk=size=100GB,type=pd-ssd,device-name=sdb --description "PMM Server on GCP" --metadata-from-file startup-script=deploy-pmm-xenial64.sh
Created [https://www.googleapis.com/compute/v1/projects/thematic-acumen-204008/zones/us-west1-b/instances/pmm-server].
NAME        ZONE        MACHINE_TYPE   PREEMPTIBLE  INTERNAL_IP  EXTERNAL_IP   STATUS
pmm-server  us-west1-b  n1-standard-4               10.138.0.2   35.233.216.225  RUNNING

Notice that we’ve used

--metadata-from-file startup-script=deploy-pmm-xenial64.sh

  The file has the following contents:

jerichorivera@percona-support:~$ cat GCE/deploy-pmm-xenial64.sh
#!/bin/bash
set -v
sudo apt-get update
sudo apt-get upgrade -y
sudo apt-get install apt-transport-https ca-certificates curl software-properties-common
curl -fsSL https://download.docker.com/linux/ubuntu/gpg | sudo apt-key add -
sudo add-apt-repository "deb [arch=amd64] https://download.docker.com/linux/ubuntu $(lsb_release -cs) stable"
sudo apt-get update
# Format the persistent disk, mount it then add to /etc/fstab
sudo mkfs.ext4 -m 0 -F -E lazy_itable_init=0,lazy_journal_init=0,discard /dev/sdb
sudo mkdir -p /mnt/disks/pdssd
sudo mount -o discard,defaults /dev/sdb /mnt/disks/pdssd/
sudo chmod a+w /mnt/disks/pdssd/
sudo cp /etc/fstab /etc/fstab.backup
echo UUID=`sudo blkid -s UUID -o value /dev/sdb` /mnt/disks/pdssd ext4 discard,defaults,nofail 0 2 | sudo tee -a /etc/fstab
# Change docker’s root directory before installing Docker
sudo mkdir /etc/systemd/system/docker.service.d/
cat << EOF > /etc/systemd/system/docker.service.d/docker.root.conf
[Service]
ExecStart=
ExecStart=/usr/bin/dockerd -H fd:// -g /mnt/disks/pdssd/docker/
EOF
sudo apt-get install -y docker-ce
# Creates the deploy.sh script
cat << EOF > /tmp/deploy.sh
#!/bin/bash
set -v
docker pull percona/pmm-server:latest
docker create -v /opt/prometheus/data -v /opt/consul-data -v /var/lib/mysql -v /var/lib/grafana --name pmm-data percona/pmm-server:latest /bin/true
docker run -d -p 80:80 --volumes-from pmm-data --name pmm-server --restart always percona/pmm-server:latest
EOF

This startup script will be executed right after the compute instance is created. The script will format the persistent disk and mount the file system; create a custom Docker unit file for the purpose of creating Docker’s root directory from /var/lib/docker to /mnt/disks/pdssd/docker; install the Docker package; and create the deploy.sh script.

2) Once the compute engine instance is created, SSH into the instance, check that Docker is running and the root directory pointing to the desired folder.

jerichorivera@pmm-server:~$ sudo systemctl status docker
? docker.service - Docker Application Container Engine
   Loaded: loaded (/lib/systemd/system/docker.service; enabled; vendor preset: enabled)
  Drop-In: /etc/systemd/system/docker.service.d
           ??docker.root.conf
   Active: active (running) since Wed 2018-05-16 12:53:30 UTC; 45s ago
     Docs: https://docs.docker.com
 Main PID: 4744 (dockerd)
   CGroup: /system.slice/docker.service
           ??4744 /usr/bin/dockerd -H fd:// -g /mnt/disks/pdssd/docker/
           ??4764 docker-containerd --config /var/run/docker/containerd/containerd.toml
May 16 12:53:30 pmm-server dockerd[4744]: time="2018-05-16T12:53:30.391566708Z" level=warning msg="Your kernel does not support swap memory limit"
May 16 12:53:30 pmm-server dockerd[4744]: time="2018-05-16T12:53:30.391638253Z" level=warning msg="Your kernel does not support cgroup rt period"
May 16 12:53:30 pmm-server dockerd[4744]: time="2018-05-16T12:53:30.391680203Z" level=warning msg="Your kernel does not support cgroup rt runtime"
May 16 12:53:30 pmm-server dockerd[4744]: time="2018-05-16T12:53:30.392913043Z" level=info msg="Loading containers: start."
May 16 12:53:30 pmm-server dockerd[4744]: time="2018-05-16T12:53:30.767048674Z" level=info msg="Default bridge (docker0) is assigned with an IP address 172.17.0.0/16. Daemon option --bip can be used to set a preferred IP address"
May 16 12:53:30 pmm-server dockerd[4744]: time="2018-05-16T12:53:30.847907241Z" level=info msg="Loading containers: done."
May 16 12:53:30 pmm-server dockerd[4744]: time="2018-05-16T12:53:30.875129963Z" level=info msg="Docker daemon" commit=9ee9f40 graphdriver(s)=overlay2 version=18.03.1-ce
May 16 12:53:30 pmm-server dockerd[4744]: time="2018-05-16T12:53:30.875285809Z" level=info msg="Daemon has completed initialization"
May 16 12:53:30 pmm-server dockerd[4744]: time="2018-05-16T12:53:30.884566419Z" level=info msg="API listen on /var/run/docker.sock"
May 16 12:53:30 pmm-server systemd[1]: Started Docker Application Container Engine.

3) Add your user to the docker group as shown below and change deploy.sh script to executable.

jerichorivera@pmm-server:~$ sudo usermod -aG docker $USER
jerichorivera@pmm-server:~$ sudo chmod +x /tmp/deploy.sh

4) Log off from the instance, and then log back in and then execute the deploy.sh script.

jerichorivera@pmm-server:~$ cd /tmp/
jerichorivera@pmm-server:/tmp$ ./deploy.sh
docker pull percona/pmm-server:latest
latest: Pulling from percona/pmm-server
697841bfe295: Pull complete
fa45d21b9629: Pull complete
Digest: sha256:98d2717b4f0ae83fbca63330c39590d69a7fca7ae6788f52906253ac75db6838
Status: Downloaded newer image for percona/pmm-server:latest
docker create -v /opt/prometheus/data -v /opt/consul-data -v /var/lib/mysql -v /var/lib/grafana --name pmm-data percona/pmm-server:latest /bin/true
8977102d419cf8955fd8bbd0ed2c663c75a39f9fbc635238d56b480ecca8e749
docker run -d -p 80:80 --volumes-from pmm-data --name pmm-server --restart always percona/pmm-server:latest
83c2e6db2efc752a6beeff0559b472f012062d3f163c042e5e0d41cda6481d33

5) Finally, create a firewall rule to allow HTTP port 80 to access the PMM Server. For security reasons, we recommend that you secure your PMM server by adding a password, or limit access to it with a stricter firewall rule to specify which IP addresses can access port 80.

jerichorivera@percona-support:~$ gcloud compute firewall-rules create allow-http-pmm-server --allow tcp:80 --target-tags pmmserver --description "Allow HTTP traffic to PMM Server"
Creating firewall...-Created [https://www.googleapis.com/compute/v1/projects/thematic-acumen-204008/global/firewalls/allow-http-pmm-server].
Creating firewall...done.
NAME                   NETWORK  DIRECTION  PRIORITY  ALLOW   DENY
allow-http-pmm-server  default  INGRESS    1000      tcp:80
jerichorivera@percona-support:~/GCE$ gcloud compute firewall-rules list
NAME                    NETWORK  DIRECTION  PRIORITY  ALLOW                         DENY
allow-http-pmm-server   default  INGRESS    1000      tcp:80
default-allow-icmp      default  INGRESS    65534     icmp
default-allow-internal  default  INGRESS    65534     tcp:0-65535,udp:0-65535,icmp
default-allow-rdp       default  INGRESS    65534     tcp:3389
default-allow-ssh       default  INGRESS    65534     tcp:22

At this point you should have a PMM Server in GCP running on a Compute Engine instance.

The next steps is to install pmm-client on the database hosts and add services for monitoring.

Here I’ve launched a single standalone Percona Server 5.6 on another Compute Engine instance in the same project (thematic-acumen-204008).

jerichorivera@percona-support:~/GCE$ gcloud compute instances create mysql1 --tags mysql1 --image-family centos-7 --image-project centos-cloud --machine-type n1-standard-2 --zone us-west1-b --create-disk=size=50GB,type=pd-standard,device-name=sdb --description "MySQL1 on GCP" --metadata-from-file startup-script=compute-instance-deploy.sh
Created [https://www.googleapis.com/compute/v1/projects/thematic-acumen-204008/zones/us-west1-b/instances/mysql1].
NAME    ZONE        MACHINE_TYPE   PREEMPTIBLE  INTERNAL_IP  EXTERNAL_IP     STATUS
mysql1  us-west1-b  n1-standard-2               10.138.0.3   35.233.187.253  RUNNING

Installed Percona Server 5.6 and pmm-client and then added services. Take note that since the PMM Server and the MySQL server is in the same project and same VPC network, we can connect directly through INTERNAL_IP 10.138.0.2, otherwise use the EXTERNAL_IP 35.223.216.225.

[root@mysql1 jerichorivera]# pmm-admin config --server 10.138.0.2
OK, PMM server is alive.
PMM Server      | 10.138.0.2
Client Name     | mysql1
Client Address  | 10.138.0.3
[root@mysql1 jerichorivera]#
[root@mysql1 jerichorivera]# pmm-admin check-network
PMM Network Status
Server Address | 10.138.0.2
Client Address | 10.138.0.3
* System Time
NTP Server (0.pool.ntp.org)         | 2018-05-22 06:45:47 +0000 UTC
PMM Server                          | 2018-05-22 06:45:47 +0000 GMT
PMM Client                          | 2018-05-22 06:45:47 +0000 UTC
PMM Server Time Drift               | OK
PMM Client Time Drift               | OK
PMM Client to PMM Server Time Drift | OK
* Connection: Client --> Server
-------------------- -------
SERVER SERVICE       STATUS
-------------------- -------
Consul API           OK
Prometheus API       OK
Query Analytics API  OK
Connection duration | 408.185µs
Request duration    | 6.810709ms
Full round trip     | 7.218894ms
No monitoring registered for this node identified as 'mysql1'.
[root@mysql1 jerichorivera]# pmm-admin add mysql --create-user
[linux:metrics] OK, now monitoring this system.
[mysql:metrics] OK, now monitoring MySQL metrics using DSN pmm:***@unix(/mnt/disks/disk1/data/mysql.sock)
[mysql:queries] OK, now monitoring MySQL queries from slowlog using DSN pmm:***@unix(/mnt/disks/disk1/data/mysql.sock)
[root@mysql1 jerichorivera]# pmm-admin list
pmm-admin 1.10.0
PMM Server      | 10.138.0.2
Client Name     | mysql1
Client Address  | 10.138.0.3
Service Manager | linux-systemd
-------------- ------- ----------- -------- ----------------------------------------------- ------------------------------------------
SERVICE TYPE   NAME    LOCAL PORT  RUNNING  DATA SOURCE                                     OPTIONS
-------------- ------- ----------- -------- ----------------------------------------------- ------------------------------------------
mysql:queries  mysql1  -           YES      pmm:***@unix(/mnt/disks/disk1/data/mysql.sock)  query_source=slowlog, query_examples=true
linux:metrics  mysql1  42000       YES      -
mysql:metrics  mysql1  42002       YES      pmm:***@unix(/mnt/disks/disk1/data/mysql.sock)

Lastly, in case you need to delete the PMM Server instance. Just execute this delete command below to completely remove the instance and the attached disk. Be aware that you may remove the boot disk and retain the attached persistent disk if you prefer.

jerichorivera@percona-support:~/GCE$ gcloud compute instances delete pmm-server
The following instances will be deleted. Any attached disks configured
 to be auto-deleted will be deleted unless they are attached to any
other instances or the `--keep-disks` flag is given and specifies them
 for keeping. Deleting a disk is irreversible and any data on the disk
 will be lost.
 - [pmm-server] in [us-west1-b]
Do you want to continue (Y/n)?  y
Deleted [https://www.googleapis.com/compute/v1/projects/thematic-acumen-204008/zones/us-west1-b/instances/pmm-server].

The other option is to install PMM on Google Container engine which was explained by Manjot Singh in his blog post.

The post Setting up PMM on Google Compute Engine in 15 minutes or less appeared first on Percona Database Performance Blog.

Jun
15
2017
--

Three Methods of Installing Percona Monitoring and Management

Installing Percona Monitoring and Management

Installing Percona Monitoring and ManagementIn this blog post, we’ll look at three different methods for installing Percona Monitoring and Management (PMM).

Percona offers multiple methods of installing Percona Monitoring and Management, depending on your environment and scale. I’ll also share comments on which installation methods we’ve decided to forego for now. Let’s begin by reviewing the three supported methods:

  1. Virtual Appliance
  2. Amazon Machine Image
  3. Docker

Virtual Appliance

We ship an OVF/OVA method to make installation as simple as possible, with the least amount of effort required and at the lowest cost to you. You can leverage the investment in your virtualization deployment platform. OVF is an open standard for packaging and distributing virtual appliances, designed to be run in virtual machines.

Using OVA with VirtualBox as a first step is common in order to quickly play with a working PMM system, and get right to adding clients and observing activity within your own environment against your MySQL and MongoDB instances. But you can also use the OVA file for enterprise deployments. It is a flexible file format that can be imported into other popular hypervisor systems such as VMware, Red Hat Virtualization, XenServer, Microsoft System Centre Virtual Machine Manager and others.

We’d love to hear your feedback on this installation method!

AWS AMI

We also have an AWS AMI in order to provide easy scaling of PMM Server in AWS, so that you can deploy onto any instance size required for your monitoring instance. Depending on the AWS region you’re in, you’ll need to choose from the appropriate AMI Instance ID. Soon we’ll be moving to the AWS Marketplace for even easier deployment. When this is implemented, you will no longer need to clone an existing AMI ID.

Docker

Docker is our most common production deployment method. It is easy (three commands) and scalable (tuning passed on the command line to Docker run). While we recognize that Docker is still a relatively new deployment system for many users, it is dramatically gaining adoption. It is also where Percona is investing the bulk of our development efforts. We deploy PMM Server as two Docker containers: one for storing the data that persists across restarts/upgrades, and the other for running the actual PMM Server binaries (Grafana, Prometheus, consul, Orchestrator, QAN, etc.).

Where are the RPM/DEB/tar.gz packages?!

A common question I hear is why doesn’t Percona support binary-based installation?

We hear you: RPM/DEB/tar.gz methods are commonly used today for many of your own applications. Percona is striving for simplicity in our deployment of PMM Server, and we spend considerable development and QA effort validating the specific versions of Grafana/Prometheus/QAN/consul/Orchestrator all work seamlessly together.

Percona wants to ensure OS compatibility and long-term support of PMM, and to do binary distribution “right” means it can quickly get expensive to build and QA across all the popular Linux distributions available today. We’re in no way against binary distributions. For example, see our list of the nine supported platforms for which we provide bug fix support.

Percona decided to focus our development efforts on stability and features, and less on the number of supported platforms. Hence the hyper-focus on Docker. We don’t have any current plans to move to a binary deployment method for PMM, but we are always open to hearing your feedback. If there is considerable interest, then please let me know via the comments below. We’ll take these thoughts into consideration for PMM planning in the second half of 2017.

Which other methods of installing Percona Monitoring and Management would you like to see?

Feb
24
2017
--

Installing Percona Monitoring and Management (PMM) for the First Time

Percona Monitoring and Management 2

Percona Monitoring and Management
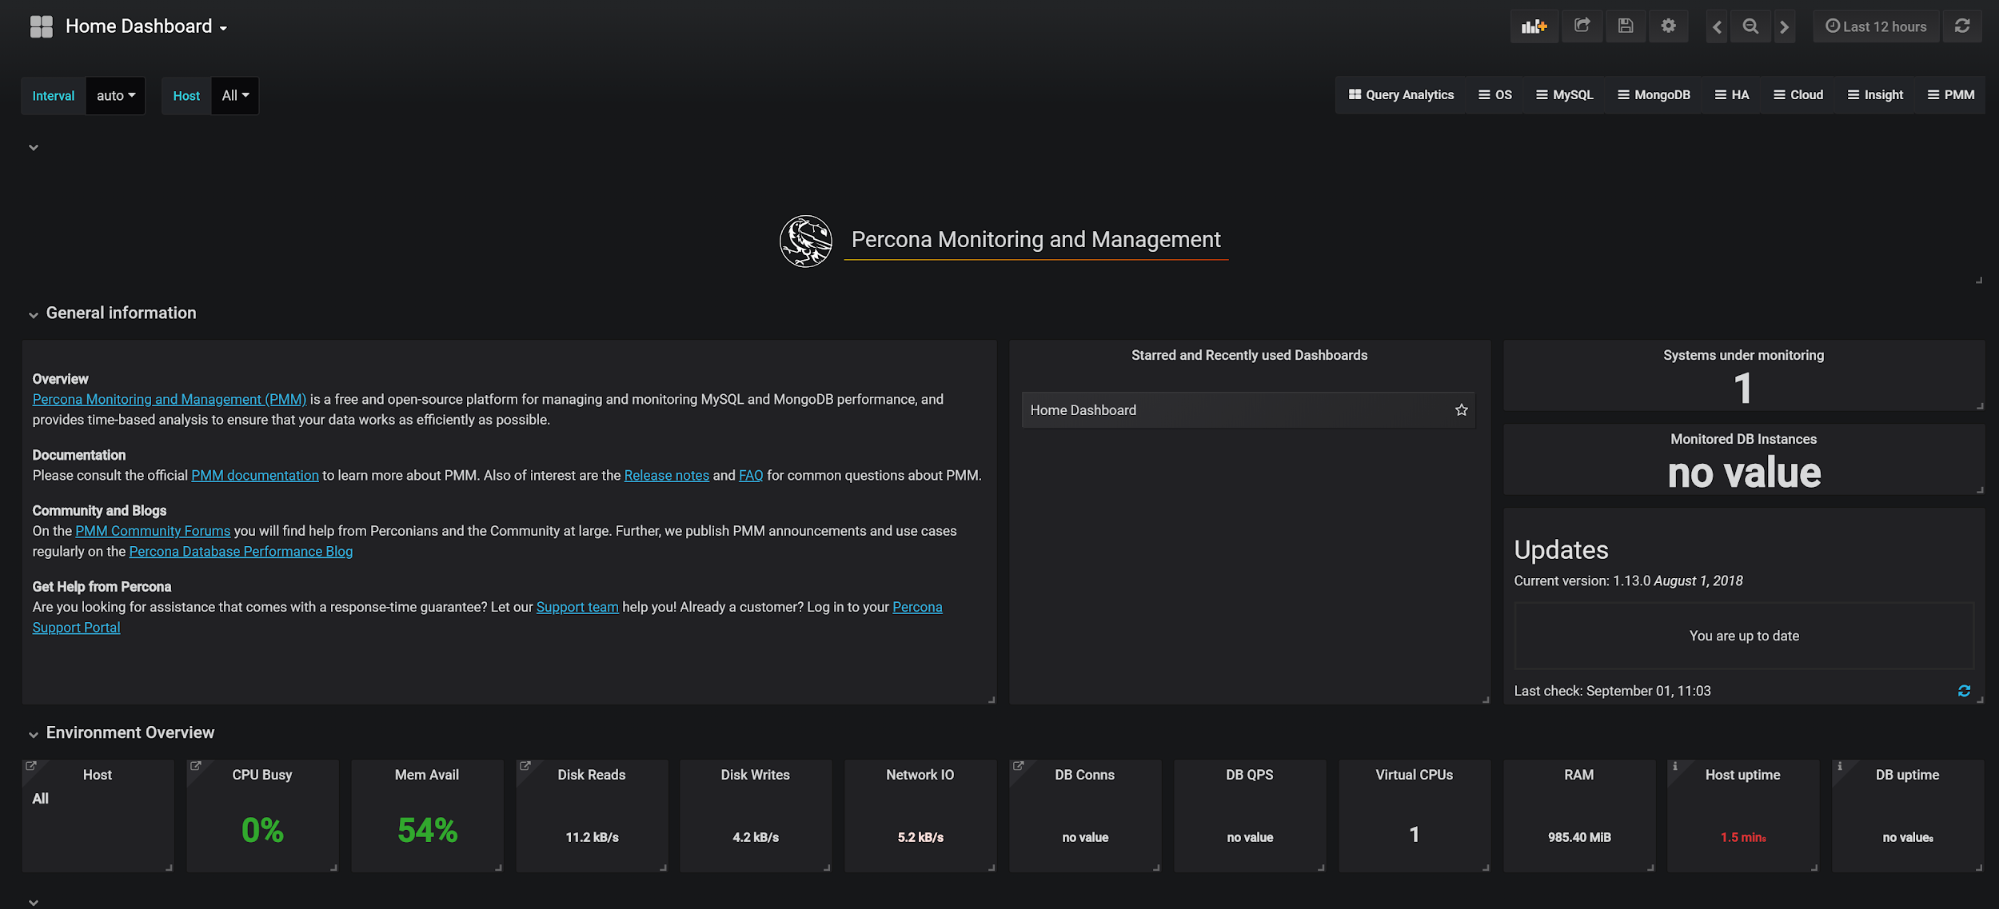
This post is another in the series on Percona’s MongoDB 3.4 bundle release. This post is meant to walk a prospective user through the benefits of Percona Monitoring and Management (PMM), how it’s architected and the simple install process. By the end of this post, you should have a good idea of what PMM is, where it can add value in your environment and how you can get PMM going quickly.

Percona Monitoring and Management (PMM) is Percona’s open-source tool for monitoring and alerting on database performance and the components that contribute to it. PMM monitors MySQL (Percona Server and MySQL CE), Amazon RDS/Aurora, MongoDB (Percona Server and MongoDB CE), Percona XtraDB/Galera Cluster, ProxySQL, and Linux.

What is it?

Percona Monitoring and Management is an amalgamation of exciting, best in class, open-source tools and Percona “engineering wizardry,” designed to make it easier to monitor and manage your environment. The real value to our users is the amount of time we’ve spent integrating the tools, plus the pre-built dashboards we’ve constructed that leverage the ten years of performance optimization experience. What you get is a tool that is ready to go out of the box, and installs in minutes. If you’re still not convinced, like ALL Percona software it’s completely FREE!

Sound good? I can hear you nodding your head. Let’s take a quick look at the architecture.

What’s it made of?

PMM, at a high-level, is made up of two basic components: the client and the server. The PMM Client is installed on the database servers themselves and is used to collect metrics. The client contains technology specific exporters (which collect and export data), and an “admin interface” (which makes the management of the PMM platform very simple). The PMM server is a “pre-integrated unit” (Docker, VM or AWS AMI) that contains four components that gather the metrics from the exporters on the PMM client(s). The PMM server contains Consul, Grafana, Prometheus and a Query Analytics Engine that Percona has developed. Here is a graphic from the architecture section of our documentation. In order to keep this post to a manageable length, please refer to that page if you’d like a more “in-depth” explanation.

How do I use it?

PMM is very easy to access once it has been installed (more on the install process below). You will simply open up the web browser of your choice and connect to the PMM Landing Page by typing

http://<ip_address_of _PMM_server>

. That takes you to the PMM landing page, where you can access all of PMM’s tools. If you’d like to get a look into the user experience, we’ve set up a great demo site so you can easily test it out.

Where should I use it?

There’s a good chance that you already have a monitoring/alerting platform for your production workloads. If not, you should set one up immediately and start analyzing trends in your environment. If you’re confident in your production monitoring solution, there is still a use for PMM in an often overlooked area: development and testing.

When speaking with users, we often hear that their development and test environments run their most demanding workloads. This is often due to stress testing and benchmarking. The goal of these workloads is usually to break something. This allows you to set expectations for normal, and thus abnormal, behavior in your production environment. Once you have a good idea of what’s “normal” and the critical factors involved, you can alert around those parameters to identify “abnormal” patterns before they cause user issues in production. The reason that monitoring is critical in your dev/test environment(s) is that you want to easily spot inflection points in your workload, which signal impending disaster. Dashboards are the easiest way for humans to consume and analyze this data.

Are you sold? Let’s get to the easiest part: installation.

How do you install it?

PMM is very easy to install and configure for two main reasons. The first is that the components (mentioned above) take some time to install, so we spent the time to integrate everything and ship it as a unit: one server install and a client install per host. The second is that we’re targeting customers looking to monitor MySQL and MongoDB installations for high-availability and performance. The fact that it’s a targeted solution makes pre-configuring it to monitor for best practices much easier. I believe we’ve all seen a particular solution that tries to do a little of everything, and thus actually does no particular thing well. This is the type of tool that we DO NOT want PMM to be. Now, onto the installation procedure.

There are four basic steps to get PMM monitoring your infrastructure. I do not want to recreate the Deployment Guide in order to maintain the future relevancy of this post. However, I’ll link to the relevant sections of the documentation so you can cut to the chase. Also, underneath each step, I’ll list some key takeaways that will save you time now and in the future.

  1. Install the integrated PMM server in the flavor of your choice (Docker, VM or AWS AMI)
    1. Percona recommends Docker to deploy PMM server as of v1.1
      1. As of right now, using Docker will make the PMM server upgrade experience seamless.
      2. Using the default version of Docker from your package manager may cause unexpected behavior. We recommend using the latest stable version from Docker’s repositories (instructions from Docker).
    2. PMM server AMI and VM are “experimental” in PMM v1.1
    3. When you open the “Metrics Monitor” for the first time, it will ask for credentials (user: admin pwd: admin).
  2. Install the PMM client on every database instance that you want to monitor.
    1. Install with your package manager for easier upgrades when a new version of PMM is released.
  3. Connect the PMM client to the PMM Server.
    1. Think of this step as sending configuration information from the client to the server. This means you are telling the client the address of the PMM server, not the other way around.
  4. Start data collection services on the PMM client.
    1. Collection services are enabled per database technology (MySQL, MongoDB, ProxySQL, etc.) on each database host.
    2. Make sure to set permissions for PMM client to monitor the database: Cannot connect to MySQL: Error 1045: Access denied for user ‘jon’@’localhost’ (using password: NO)
      1. Setting proper credentials uses this syntax sudo pmm-admin add <service_type> –user xxxx –password xxxx
    3. There’s good information about PMM client options in the “Managing PMM Client” section of the documentation for advanced configurations/troubleshooting.

What’s next?

That’s really up to you, and what makes sense for your needs. However, here are a few suggestions to get the most out of PMM.

  1. Set up alerting in Grafana on the PMM server. This is still an experimental function in Grafana, but it works. I’d start with Barrett Chambers’ post on setting up email alerting, and refine it with  Peter Zaitsev’s post.
  2. Set up more hosts to test the full functionality of PMM. We have completely free, high-performance versions of MySQL, MongoDB, Percona XtraDB Cluster (PXC) and ProxySQL (for MySQL proxy/load balancing).
  3. Start load testing the database with benchmarking tools to build your troubleshooting skills. Try to break something to learn what troubling trends look like. When you find them, set up alerts to give you enough time to fix them.

Powered by WordPress | Theme: Aeros 2.0 by TheBuckmaker.com