Jan
11
2021
--

Full Read Consistency Within Percona Kubernetes Operator for Percona XtraDB Cluster

Full Read Consistency Within Percona Kubernetes Operator

Full Read Consistency Within Percona Kubernetes OperatorThe aim of Percona Kubernetes Operator for Percona XtraDB Cluster is to be a special type of controller introduced to simplify complex deployments. The Operator extends the Kubernetes API with custom resources. The Operator solution is using Percona XtraDB Cluster (PXC) behind the hood to provide a highly available, resilient, and scalable MySQL service in the Kubernetes space. 

This solution comes with all the advantages/disadvantages provided by Kubernetes, plus some advantages of its own like the capacity to scale reads on the nodes that are not Primary.

Of course, there are some limitations like the way PXC handles DDLs, which may impact the service, but there is always a cost to pay to get something, expecting to have it all for free is unreasonable.     

In this context, we need to talk and cover what is full read consistency in this solution and why it is important to understand the role it plays.  

Stale Reads

When using Kubernetes we should talk about the service and not about the technology/product used to deliver such service. 

In our case, the Percona Operator is there to deliver a MySQL service. We should then see that as a whole, as a single object. To be more clear what we must consider is NOT the fact we have a cluster behind the service but that we have a service that to be resilient and highly available, use a cluster. 

We should not care if a node/pod goes down unless the service is discontinued.

What we have as a plus in the Percona Operator solution is a certain level of READ scalability. This achieved optimizing the use of the non PRIMARY nodes, and instead of having them sitting there applying only replicated data, the Percona Operator provides access to them to scale the reads.  

But… there is always a BUT ? 

Let us start with an image:


By design, the apply and commit finalize in Galera (PXC) may have (and has) a delay between nodes. This means that, if using defaults, applications may have inconsistent reads if trying to access the data from different nodes than the Primary. 

It provides access using two different solutions:

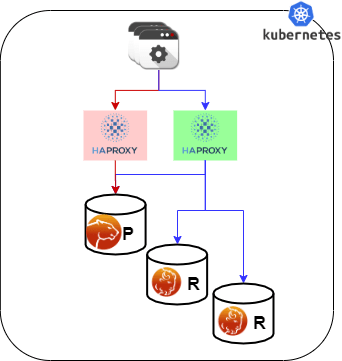
  • Using HAProxy (default)
  • Using ProxySQL


When using HAProxy you will have 2 entry points:

  • cluster1-haproxy, which will point to the Primary ONLY, for reads and writes. This is the default entry point for the applications to the MySQL database.
  • cluster1-haproxy-replicas, which will point to all three nodes and is supposed to be used for READS only. This is the PLUS you can use if your application has READ/WRITE separation.

Please note that at the moment there is nothing preventing an application to use the cluster1-haproxy-replicas also for write, but that is dangerous and wrong because will generate a lot of certification conflicts and BF abort given it will distribute writes all over the cluster impacting on performance as well (and not giving you any write scaling):


[marcotusa@instance-1 ~]$ for i in `seq 1 100`; do mysql -h cluster1-haproxy-replicas -e "insert into test.iamwritingto values(null,@@hostname)";done
+----------------+-------------+
| host           | count(host) |
+----------------+-------------+
| cluster1-pxc-1 |          34 |
| cluster1-pxc-2 |          33 |
| cluster1-pxc-0 |          33 |
+----------------+-------------+

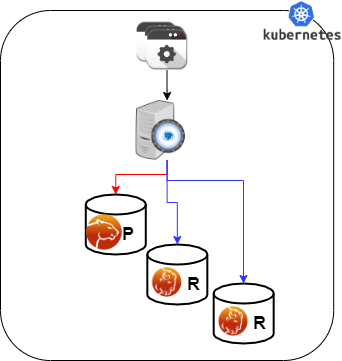
When using ProxySQL the entry point is a single one, but you may define query rules to automatically split the R/W requests coming from the application. This is the preferred method when an application has no way to separate the READS from the writes.

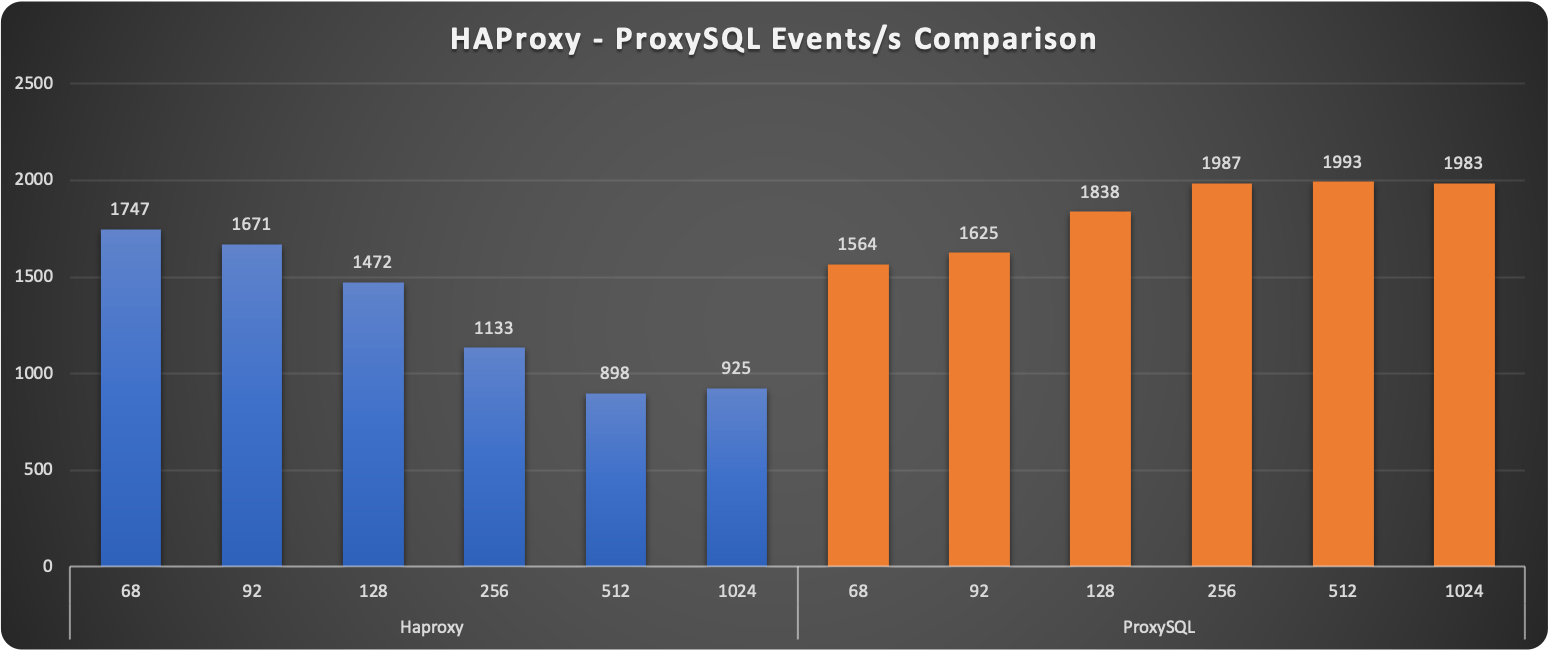
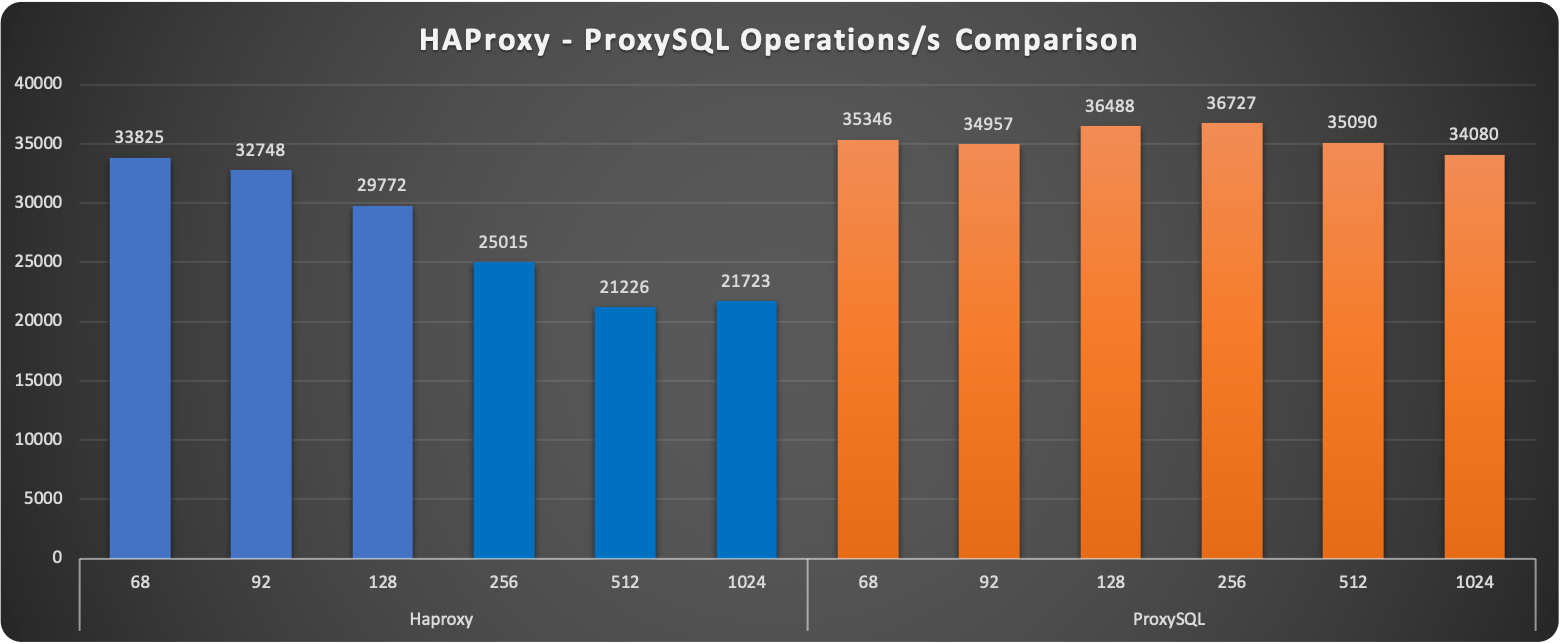
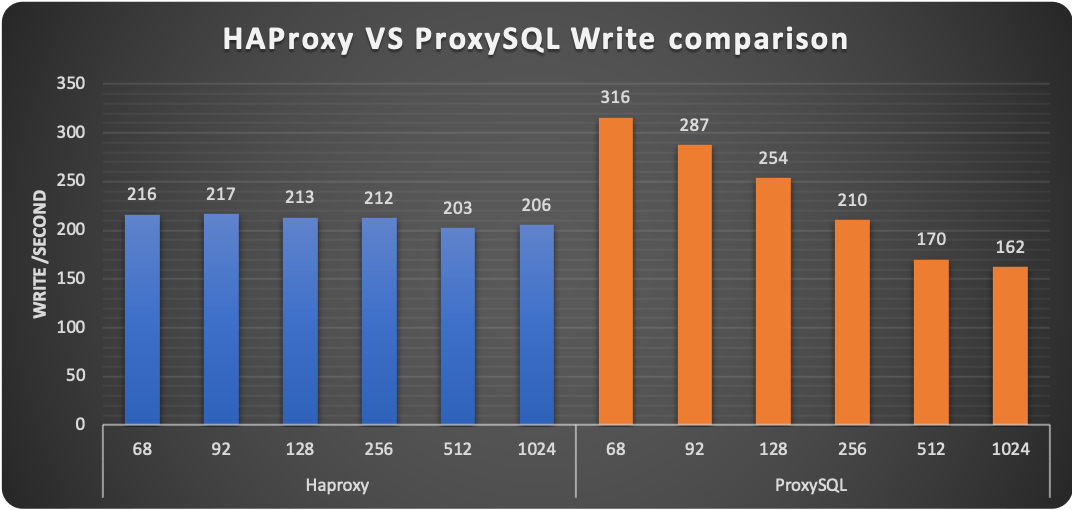
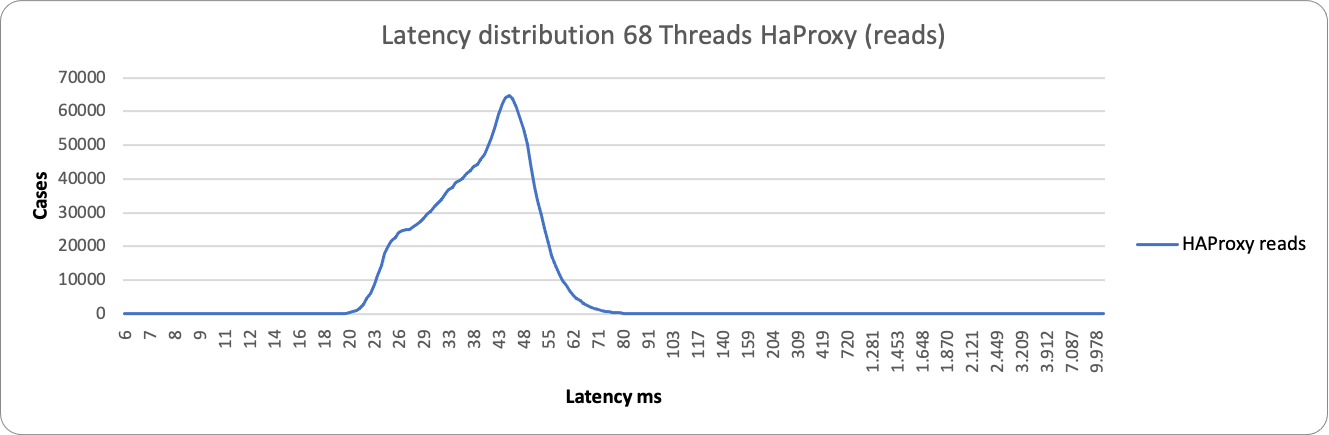
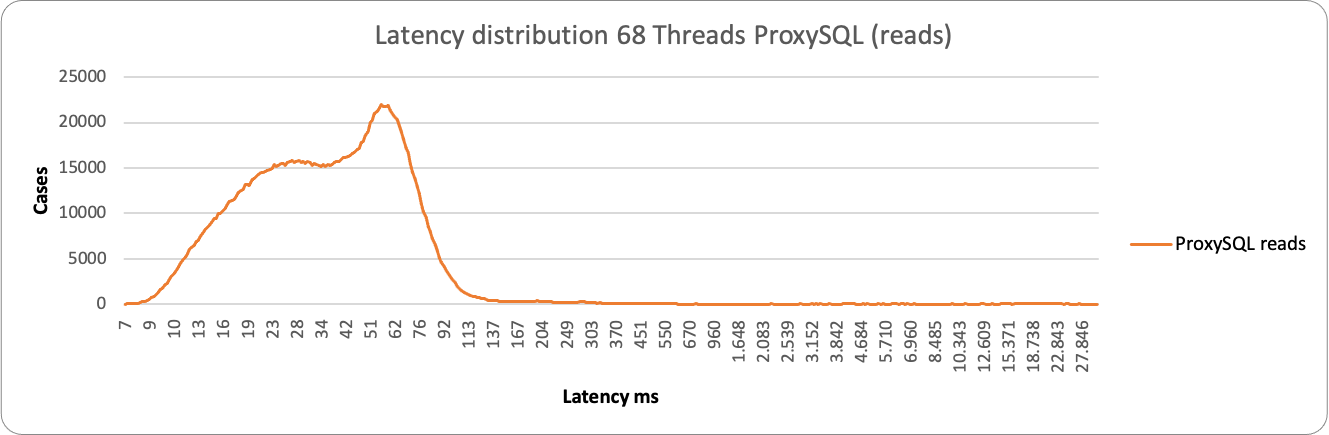
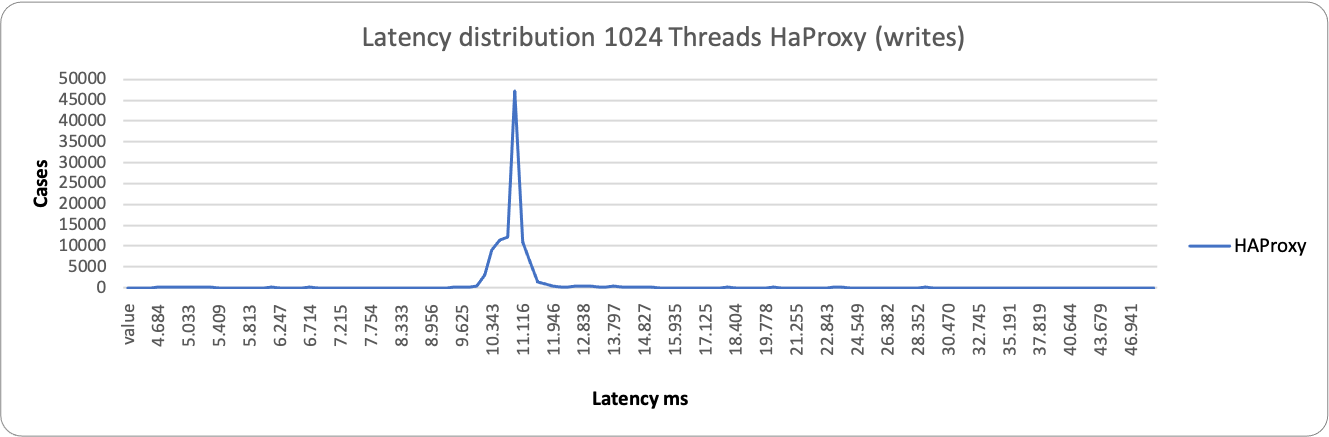
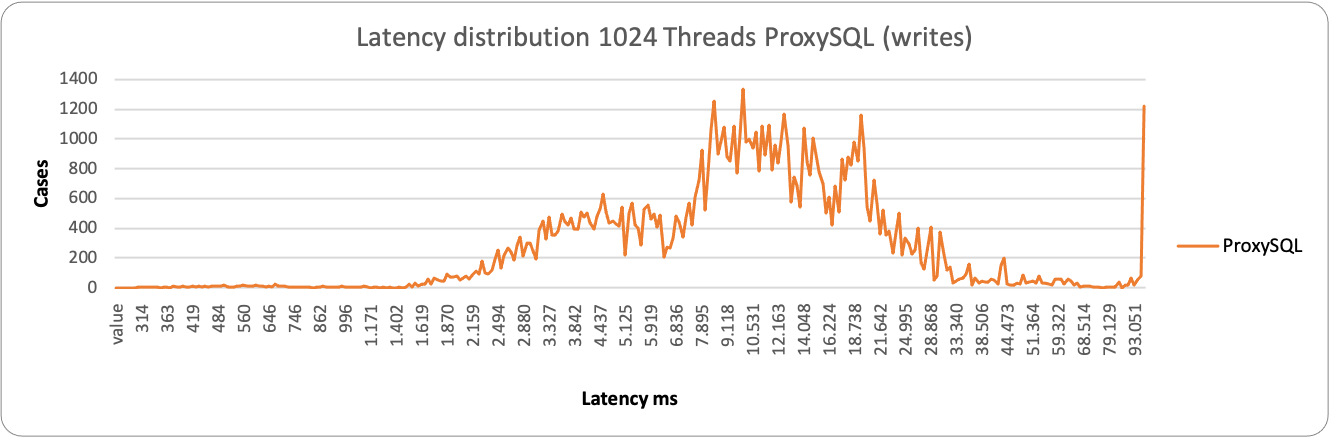
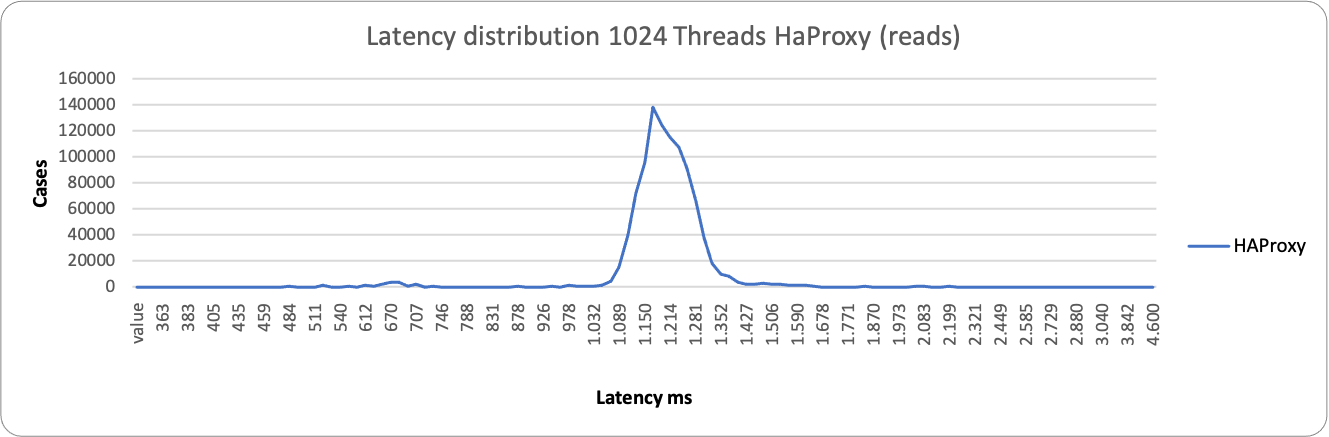
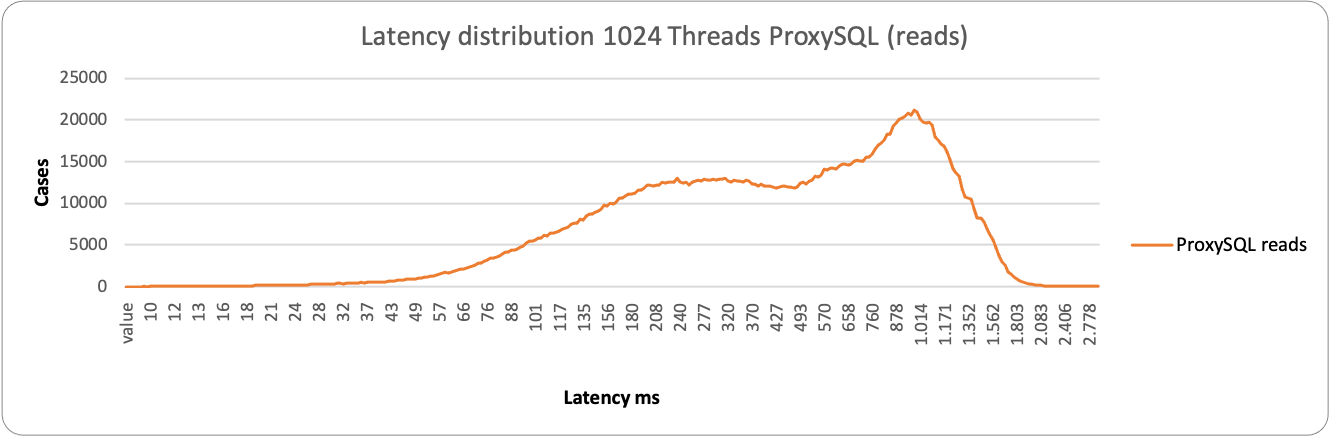
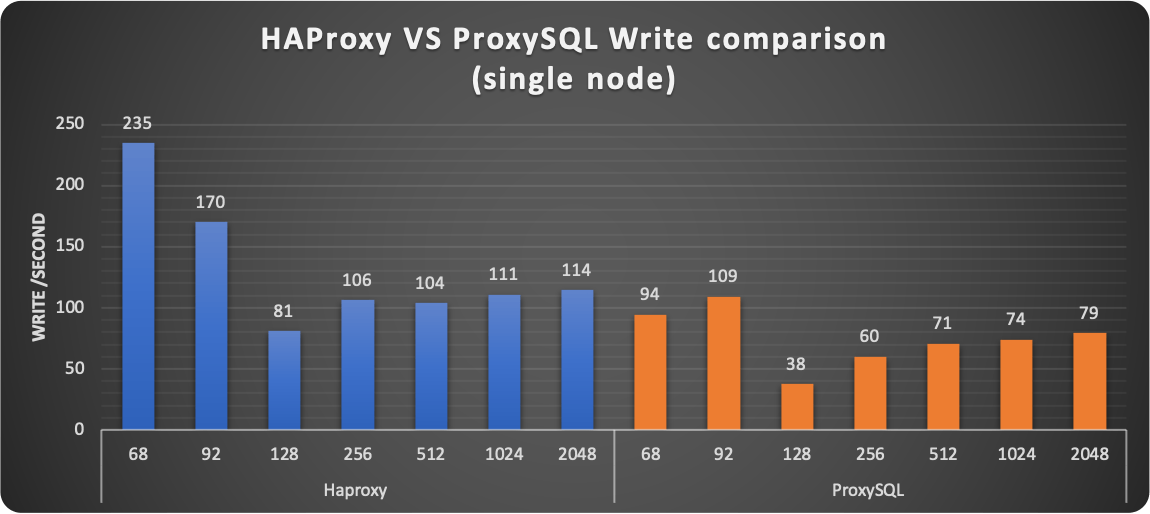
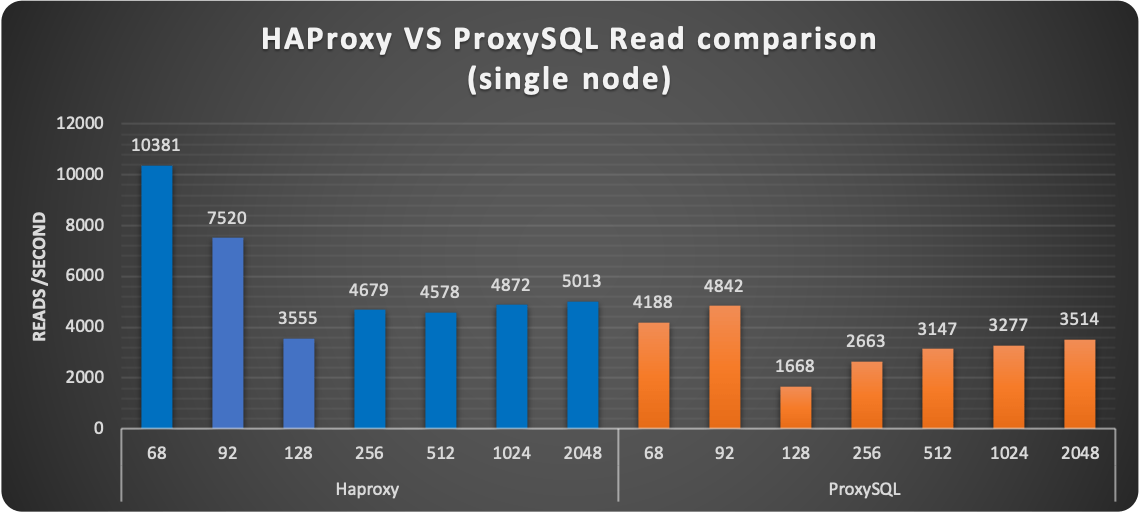
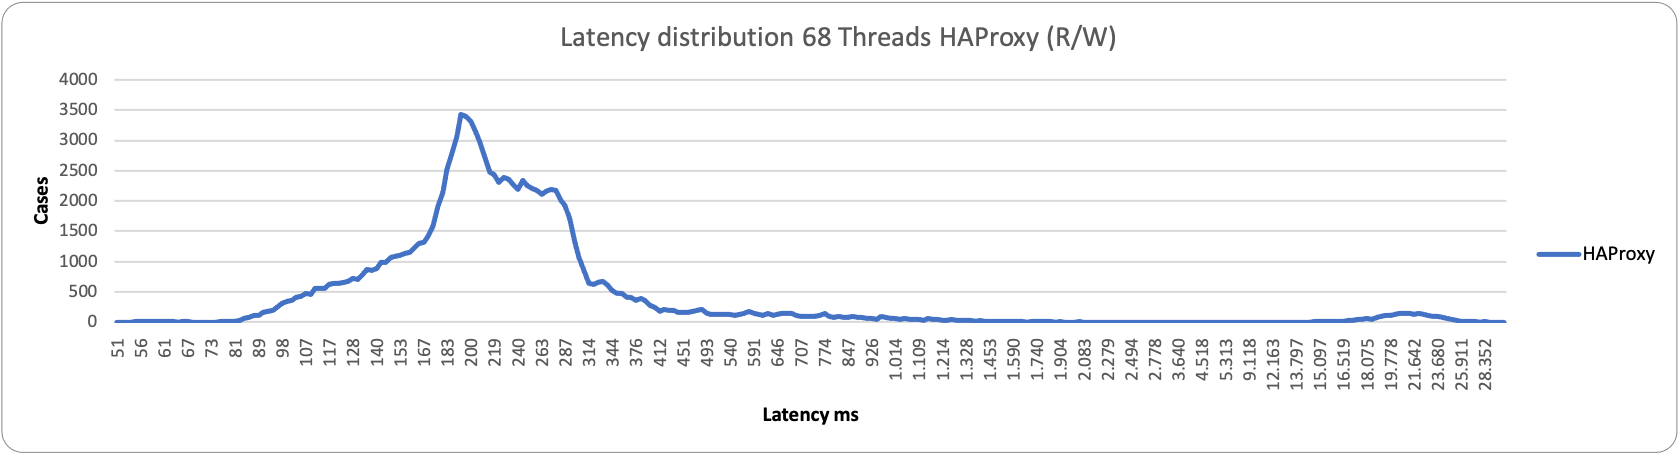
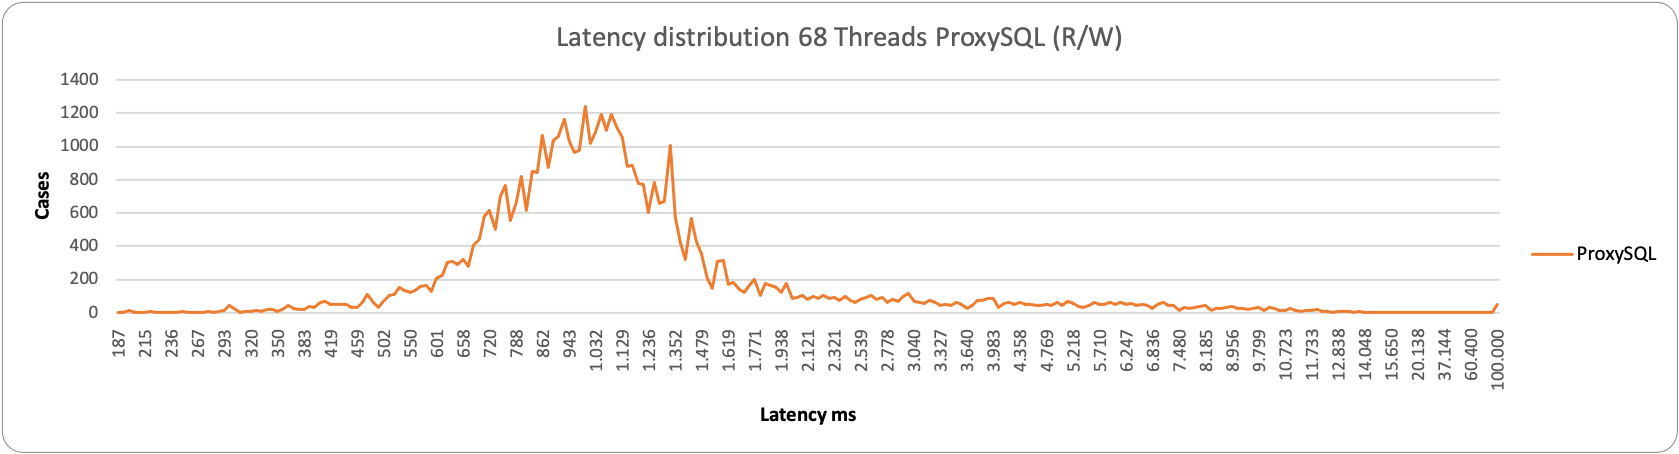
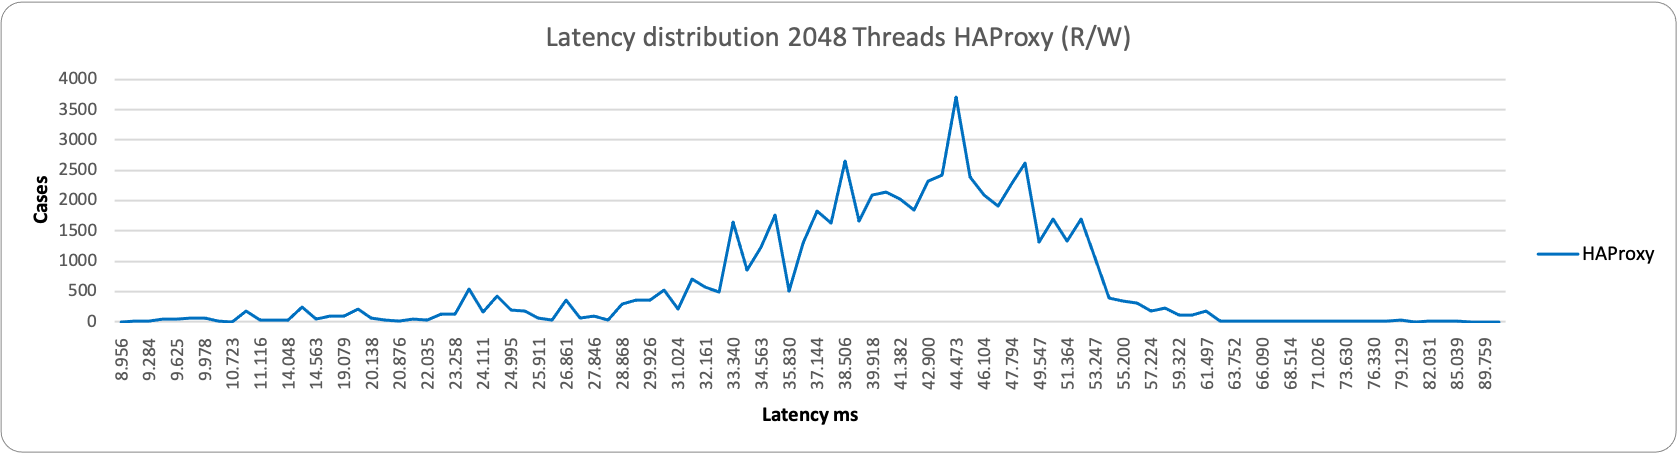
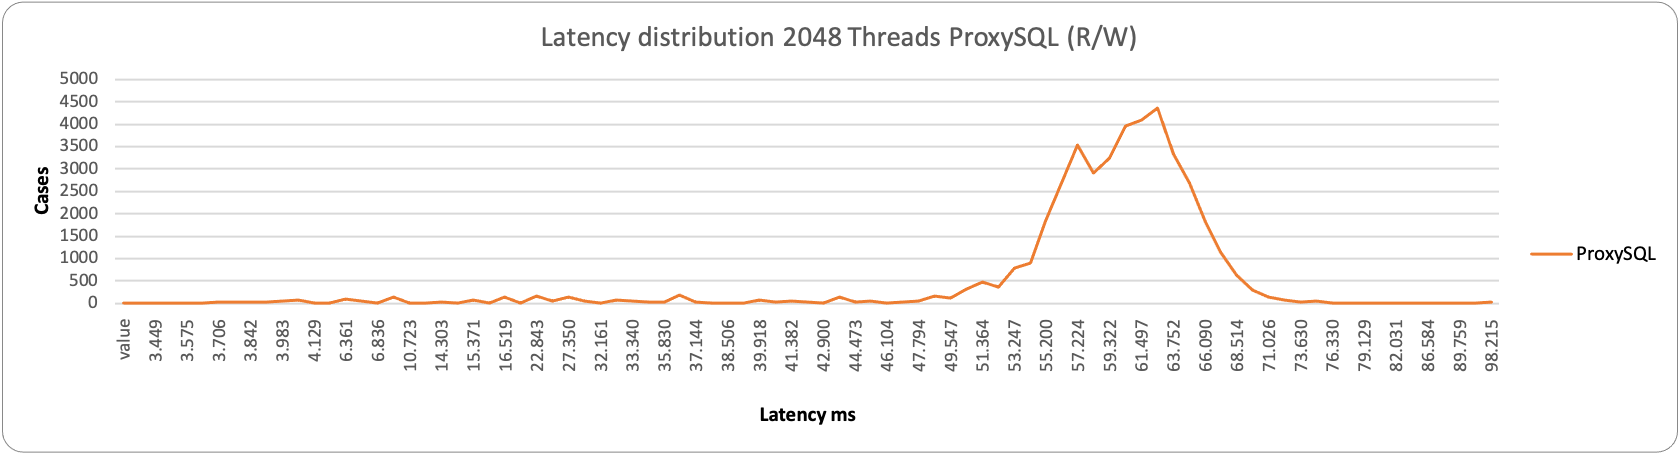
Here I have done a comparison of the two methods, HAProxy and ProxySQL.

Now, as mentioned above, by default, PXC (any Galera base solution) comes with some relaxed settings, for performance purposes. This is normally fine in many standard cases, but if you use the Percona Operator and use the PLUS of scaling reads using the second access point with HAproxy or Query Rules with Proxysql, you should NOT have stale reads, given the service must provide consistent data, as if you are acting on a single node. 

To achieve that you can change the defaults and change the parameter in PXC wsrep_sync_wait. 

When changing the parameter wsrep_sync_wait as explained in the documentation, the node initiates a causality check, blocking incoming queries while it catches up with the cluster. 

Once all data on the node receiving the READ request is commit_finalized, the node performs the read.

But this has a performance impact, as said before.

What Is The Impact?

To test the performance impact I had used a cluster deployed in GKE, with these characteristics:

  • 3 Main nodes n2-standard-8 (8 vCPUs, 32 GB memory)
  • 1 App node n2-standard-8 (8 vCPUs, 32 GB memory)
  • PXC pods using:
    •  25GB of the 32 available 
    • 6 CPU of the 8 available
  • HAProxy:
    • 600m CPU
    • 1GB RAM
  • PMM agent
    • 500m CPU
    • 500 MB Ram

In the application node, I used sysbench running two instances, one in r/w mode the other only reads. Finally, to test the stale read, I used the stale read test from my test suite.

Given I was looking for results with a moderate load, I just used 68/96/128 threads per sysbench instance. 

Results

Marco, did we have or not have stale reads? Yes, we did:

I had from 0 (with very light load) up to 37% stale reads with a MODERATED load, where moderated was the 128 threads sysbench running. 

Setting wsrep_sync_wait=3 of course I had full consistency.  But I had performance loss:

As you can see, I had an average loss of 11% in case of READS:

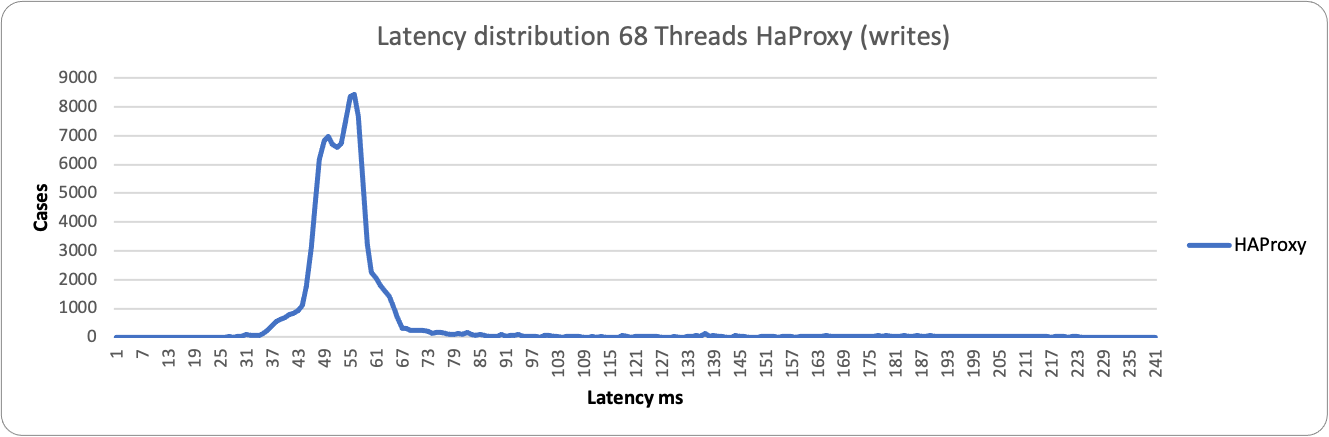
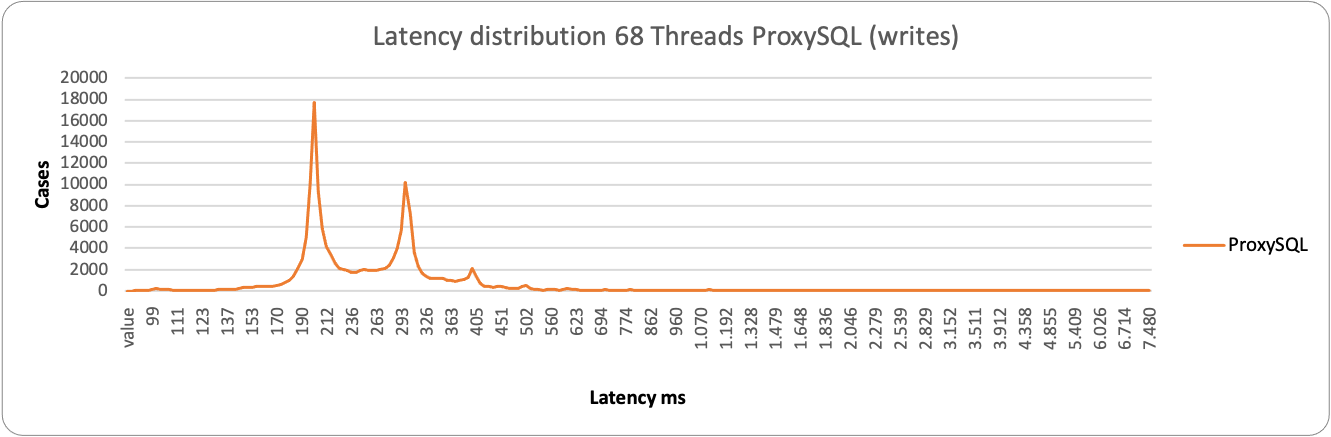
While for writes the average loss was 16%. 

Conclusions

At this point, we need to stop and think about what is worth doing. If my application is READs heavy and READs scaling, it is probably worth enabling the full synchronicity given scaling on the additional node allows me to have 2x or more READs. 

If instead my application is write critical, probably losing also ~16% performance is not good.

Finally if my application is stale reads tolerant, I will just go with the defaults and get all the benefits without penalties.

Also keep in mind that Percona Kubernetes Operator for Percona XtraDB Cluster is designed to offer a MySQL service so the state of the single node is not as critical as if you are using a default PXC installation, PODs are by nature ephemeral objects while service is resilient.

References

Percona Kubernetes Operator for Percona XtraDB Cluster

https://github.com/Tusamarco/testsuite

https://en.wikipedia.org/wiki/Isolation_(database_systems)#Dirty_reads

https://galeracluster.com/library/documentation/mysql-wsrep-options.html#wsrep-sync-wait

https://www.slideshare.net/lefred.descamps/galera-replication-demystified-how-does-it-work

Jan
11
2021
--

Percona Kubernetes Operator for Percona XtraDB Cluster: HAProxy or ProxySQL?

Percona Kubernetes Operator HAProxy or ProxySQL

Percona Kubernetes Operator HAProxy or ProxySQLPercona Kubernetes Operator for Percona XtraDB Cluster comes with two different proxies, HAProxy and ProxySQL. While the initial version was based on ProxySQL, in time, Percona opted to set HAProxy as the default Proxy for the operator, without removing ProxySQL. 

While one of the main points was to guarantee users to have a 1:1 compatibility with vanilla MySQL in the way the operator allows connections, there are also other factors that are involved in the decision to have two proxies. In this article, I will scratch the surface of this why.

Operator Assumptions

When working with the Percona Operator, there are few things to keep in mind:

  • Each deployment has to be seen as a single MySQL service as if a single MySQL instance
  • The technology used to provide the service may change in time
  • Pod resiliency is not guaranteed, service resiliency is
  • Resources to be allocated are not automatically calculated and must be identified at the moment of the deployment
  • In production, you cannot set more than 5 or less than 3 nodes when using PXC

There are two very important points in the list above.

The first one is that what you get IS NOT a Percona XtraDB Cluster (PXC), but a MySQL service. The fact that Percona at the moment uses PXC to cover the service is purely accidental and we may decide to change it anytime.

The other point is that the service is resilient while the pod is not. In short, you should expect to see pods stopping to work and being re-created. What should NOT happen is that service goes down. Trying to debug each minor issue per node/pod is not what is expected when you use Kubernetes. 

Given the above, review your expectations… and let us go ahead. 

The Plus in the Game (Read Scaling)

As said, what is offered with Percona Operator is a MySQL service. Percona has added a proxy on top of the nodes/pods that help the service to respect the resiliency service expectations. There are two possible deployments:

  • HAProxy
  • ProxySQL

Both allow optimizing one aspect of the Operator, which is read scaling. In fact what we were thinking was, given we must use a (virtually synchronous) cluster, why not take advantage of that and allow reads to scale on the other nodes when available? 

This approach will help all the ones using POM to have the standard MySQL service but with a plus. 

But, with it also comes with some possible issues like READ/WRITE splitting and stale reads. See this article about stale reads on how to deal with it. 

For R/W splitting we instead have a totally different approach in respect to what kind of proxy we implement. 

If using HAProxy, we offer a second entry point that can be used for READ operation. That entrypoint will balance the load on all the nodes available. 

Please note that at the moment there is nothing preventing an application to use the cluster1-haproxy-replicas also for write, but that is dangerous and wrong because will generate a lot of certification conflicts and BF abort, given it will distribute writes all over the cluster impacting on performance as well (and not giving you any write scaling). It is your responsibility to guarantee that only READS will go through that entrypoint.

If instead ProxySQL is in use, it is possible to implement automatic R/W splitting. 

Global Difference and Comparison

At this point, it is useful to have a better understanding of the functional difference between the two proxies and what is the performance difference if any. 

As we know HAProxy acts as a level 4 proxy when operating in TCP mode, it also is a forward-proxy, which means each TCP connection is established with the client with the final target and there is no interpretation of the data-flow.

ProxySQL on the other hand is a level 7 proxy and is a reverse-proxy, this means the client establishes a connection to the proxy who presents itself as the final backend. Data can be altered on the fly when it is in transit. 

To be honest, it is more complicated than that but allows me the simplification. 

On top of that, there are additional functionalities that are present in one (ProxySQL) and not in the other. The point is if they are relevant for use in this context or not. For a shortlist see below (source is from ProxySQL blog but data was removed) : 

As you may have noticed HAProxy is lacking some of that functionalities, like R/W split, firewalling, and caching, proper of the level 7 implemented in ProxySQL.  

The Test Environment

To test the performance impact I had used a cluster deployed in GKE, with these characteristics:

  • 3 Main nodes n2-standard-8 (8 vCPUs, 32 GB memory)
  • 1 App node n2-standard-8 (8 vCPUs, 32 GB memory)
  • PXC pods using:
    •  25GB of the 32 available 
    • 6 CPU of the 8 available
  • HAProxy:
    • 600m CPU
    • 1GB RAM
  • PMM agent
    • 500m CPU
    • 500 MB Ram
  • Tests using sysbench as for (https://github.com/Tusamarco/sysbench), see in GitHub for command details.

What I have done is to run several tests running two Sysbench instances. One only executing reads, while the other reads and writes. 

In the case of ProxySQL, I had R/W splitting thanks to the Query rules, so both sysbench instances were pointing to the same address. While testing HAProxy I was using two entry points:

  • Cluster1-haproxy – for read and write
  • Cluster1-haproxy-replicas – for read only

Then I also compare what happens if all requests hit one node only. For that, I execute one Sysbench in R/W mode against one entry point, and NO R/W split for ProxySQL.

Finally, sysbench tests were executed with the –reconnect option to force the tests to establish new connections.

As usual, tests were executed multiple times, on different days of the week and moments of the day. Data reported is a consolidation of that, and images from Percona Monitoring and Management (PMM) are samples coming from the execution that was closest to the average values. 

Comparing Performance When Scaling Reads

These tests imply that one node is mainly serving writes while the others are serving reads. To not affect performance, and given I was not interested in maintaining full read consistency, the parameter wsrep_sync_wait was kept as default (0). 

HAProxy

HAProxy ProxySQL

A first observation shows how ProxySQL seems to keep a more stable level of requests served. The increasing load penalizes HAProxy reducing if ? the number of operations at 1024 threads.

HAProxy ProxySQL HAProxy ProxySQL read comparison

Digging a bit more we can see that HAProxy is performing much better than ProxySQL for the WRITE operation. The number of writes remains almost steady with minimal fluctuations. ProxySQL on the other hand is performing great when the load in write is low, then performance drops by 50%.

For reads, we have the opposite. ProxySQL is able to scale in a very efficient way, distributing the load across the nodes and able to maintain the level of service despite the load increase. 

If we start to take a look at the latency distribution statistics (sysbench histogram information), we can see that:

latency HAProxy latency ProxySQL

In the case of low load and writes, both proxies stay on the left side of the graph with a low value in ms. HAProxy is a bit more consistent and grouped around 55ms value, while ProxySQL is a bit more sparse and spans between 190-293ms.

About reads we have similar behavior, both for the large majority between 28-70ms. We have a different picture when the load increases:  

ProxySQL is having some occurrences where it performs better, but it spans in a very large range, from ~2k ms to ~29k ms. While HAProxy is substantially grouped around 10-11K ms. As a result, in this context, HAProxy is able to better serve writes under heavy load than ProxySQL. 

Again, a different picture in case of reads.

Here ProxySQL is still spanning on a wide range ~76ms – 1500ms, while HAProxy is more consistent but less efficient, grouping around 1200ms the majority of the service. This is consistent with the performance loss we have seen in READ when using high load and HAProxy.  

Comparing When Using Only One Node

But let us now discover what happens when using only one node. So using the service as it should be, without the possible Plus of read scaling. 

Percona Kubernetes Operator for Percona XtraDB Cluster

The first thing I want to mention is strange behavior that was consistently happening (no matter what proxy used) at 128 threads. I am investigating it but I do not have a good answer yet on why the Operator was having that significant drop in performance ONLY with 128 threads.

Aside from that, the results were consistently showing HAProxy performing better in serving read/writes. Keep in mind that HAProxy just establishes the connection point-to-point and is not doing anything else. While ProxySQL is designed to eventually act on the incoming stream of data. 

This becomes even more evident when reviewing the latency distribution. In this case, no matter what load we have, HAProxy performs better:

As you can notice, HAProxy is less grouped than when we have two entry points, but it is still able to serve more efficiently than ProxySQL.

Conclusions

As usual, my advice is to use the right tool for the job, and do not force yourself into something stupid. And as clearly stated at the beginning, Percona Kubernetes Operator for Percona XtraDB Cluster is designed to provide a MySQL SERVICE, not a PXC cluster, and all the configuration and utilization should converge on that.

ProxySQL can help you IF you want to scale a bit more on READS using the possible plus. But this is not guaranteed to work as it works when using standard PXC. Not only do you need to have a very good understanding of Kubernetes and ProxySQL if you want to avoid issues, but with HAProxy you can scale reads as well, but you need to be sure you have R/W separation at the application level.

In any case, utilizing HAProxy for the service is the easier way to go. This is one of the reasons why Percona decided to shift to HAProxy. It is the solution that offers the proxy service more in line with the aim of the Kubernetes service concept. It is also the solution that remains closer to how a simple MySQL service should behave.

You need to set your expectations correctly to avoid being in trouble later.

References

Percona Kubernetes Operator for Percona XtraDB Cluster


Wondering How to Run Percona XtraDB Cluster on Kubernetes? Try Our Operator!

The Criticality of a Kubernetes Operator for Databases


Aug
11
2020
--

Smart Update Strategy in Percona Kubernetes Operator for Percona XtraDB Cluster

smart update strategy percona kubernetes opeerator

smart update strategy percona kubernetes opeeratorIn Percona Kubernetes Operator for Percona XtraDB Cluster (PXC) versions prior to 1.5.0, there were two methods for upgrading PXC clusters, and both of these use built-in StatefulSet update strategies. The first one is manual (OnDelete update strategy) and the second one is semi-automatic (RollingUpdate strategy). Since the Kubernetes operator is about automating the database management, and there are use cases to always keep the database up to date, a new smart update strategy was implemented.

Smart Update Strategy

The smart update strategy can be used to enable automatic context-aware upgrades of PXC clusters between minor versions. One of the use cases for automatic upgrades is if you want to get security updates as soon as they get released.

This strategy will upgrade reader PXC Pods at first and the last one upgraded will be the writer Pod, and it will also wait for the upgraded Pod to show up as online in ProxySQL before the next Pod is upgraded. This is needed to minimize the number of failovers during the upgrade and to make the upgrade as smooth as possible.

To make this work we implemented a version-unaware entrypoint and a Version Service to be queried for the up-to-date versions information.

The non-version specific entrypoint script is included in the operator docker image and is used to start different PXC versions. This makes the operator version not tightly coupled with a specific PXC docker image like it was done before, so one version of the operator will be able to run multiple versions of PXC cluster.

Version Service, which runs at https://check.percona.com/ by default, provides database version and alert information for various open source products. Version Service is open source and it can be run inside your own infrastructure, but that will be covered in some other blog posts.

How Does it Work?

When smart update is enabled and a new cluster has started, the values for docker images in the cr.yaml file will be ignored since the intention is to get them from the Version Service.

If smart update is enabled for an existing cluster, then at the scheduled time a version of the currently running PXC cluster, Kubernetes operator version, and the desired upgrade path will be provided to the Version Service. Version Service will return the JSON object with a set of docker images that should be used in the current environment. After that, the operator will update the CR with the new image paths and continue with deleting and redeploying the Pods in optimal order to minimize failovers.

The upgrade will not be done if the backup operation is in progress during the check for updates since the backup has a higher priority, but instead, it will be done next time the Version Service is checked.

With smart update functionality, you can also lock your database to a specific version, basically disabling automatic upgrades, but when needed use the smart update to trigger context-aware upgrades or just changes to resources.

This is how the upgrade might look in the operator logs (some parts stripped for brevity):

{"level":"info","ts":..,"logger":"..","msg":"update PXC version to 5.7.29-32-57 (fetched from db)"}
{"level":"info","ts":..,"logger":"..","msg":"add new job: * * * * *"}
{"level":"info","ts":..,"logger":"..","msg":"update PXC version from 5.7.29-32-57 to 5.7.30-31.43"}
{"level":"info","ts":..,"logger":"..","msg":"statefullSet was changed, run smart update"}
{"level":"info","ts":..,"logger":"..","msg":"primary pod is cluster1-pxc-0.cluster1-pxc.pxc-test.svc.cluster.local"}
{"level":"info","ts":..,"logger":"..","msg":"apply changes to secondary pod cluster1-pxc-2"}
{"level":"info","ts":..,"logger":"..","msg":"pod cluster1-pxc-2 is running"}
{"level":"info","ts":..,"logger":"..","msg":"pod cluster1-pxc-2 is online"}
{"level":"info","ts":..,"logger":"..","msg":"apply changes to secondary pod cluster1-pxc-1"}
{"level":"info","ts":..,"logger":"..","msg":"pod cluster1-pxc-1 is running"}
{"level":"info","ts":..,"logger":"..","msg":"pod cluster1-pxc-1 is online"}
{"level":"info","ts":..,"logger":"..","msg":"apply changes to primary pod cluster1-pxc-0"}
{"level":"info","ts":..,"logger":"..","msg":"pod cluster1-pxc-0 is running"}
{"level":"info","ts":..,"logger":"..","msg":"pod cluster1-pxc-0 is online"}
{"level":"info","ts":..,"logger":"..","msg":"smart update finished"}

As you can see, the initial PXC version deployed is 5.7.29, after which the smart update was enabled with the schedule to check for updates every minute (this is done for the test only). After that, smart update contacted the Version Service and started the upgrade process to version 5.7.30. The Primary Pod identified was PXC Pod 0, so firstly Pods 2 and 1 (readers) were upgraded, and only after that Pod 0 (writer), and at the end, the message was logged that the upgrade process finished.

Configuration Options Inside cr.yaml File

spec:
  updateStrategy: SmartUpdate
  upgradeOptions:
    versionServiceEndpoint: https://check.percona.com/versions
    apply: recommended
    schedule: "0 4 * * *"

As already mentioned, updateStrategy can be OnDelete or RollingUpdate in previous versions, but to use automatic upgrades it should be set to SmartUpdate.

Value of the upgradeOptions.versionServiceEndpoint option can be changed from the default if you have your own Version Service running (e.g. if your cluster doesn’t have a connection to the Internet and you have your own custom docker image repositories).

The most important setting is the upgradeOptions.apply option, which can have several values:

  • Never or Disabled – automatic upgrades are disabled and smart update is only utilized for other types of full cluster changes such as resource alterations or ConfigMap updates.
  • Recommended – automatic upgrades will choose the most recent version of software flagged as Recommended.
  • Latest – automatic upgrades will choose the most recent version of the software available.
    If you are starting a cluster from scratch and you have selected Recommended or Latest as desired versions, the current 8.0 major version will be selected. If you are already running a cluster, in that case, Version Service should always return the upgrade path inside your major version. Basically, if you want to start with a 5.7 major version from scratch, you should explicitly specify some 5.7 version (see below). Then, after the cluster is deployed, if you wish to enable automatic upgrades, you need to change the value of upgradeOptions.apply to “Recommended” or “Latest”.
  • Version Number – when a version number is supplied, this will start an upgrade if the running version doesn’t match the explicit version and then all future upgrades are no-ops. This essentially locks your database cluster to a specific database version. Example values for this can be “ 5.7.30-31.43” or “8.0.19-10.1”.

upgradeOptions.schedule is a classic cron schedule option and by default, it is set to check for new versions every day at 4 AM.

Limitations

A smart update strategy can only be used to upgrade PXC clusters and not the operator itself. It will only do the minor version upgrade automatically and it cannot be used for downgrades (since, as you may know, the downgrades in MySQL from version 8 might be problematic even between minor versions).

Conclusion

If there is a need to always keep the PXC cluster upgraded to the latest/recommended version, or if you just want to facilitate some benefits of the new smart update strategy even without automatic upgrades functionality, you can use version 1.5.0 of the Percona Kubernetes Operator for Percona XtraDB Cluster for this.

Powered by WordPress | Theme: Aeros 2.0 by TheBuckmaker.com