Oct
27
2020
--

A First Glance at Amazon Aurora Serverless RDS

Amazon Aurora Serverless

Amazon Aurora ServerlessIf you often deploy services in the cloud, you certainly, at least once, forgot to stop a test instance. I am like you and I forgot my share of these. Another mistake I do once in a while is to provision a bigger instance than needed, just in case, and forget to downsize it. While this is true for compute instances, it is especially true for database instances. Over time, this situation ends up adding a cost premium. In this post, we’ll discuss a solution to mitigate these extra costs, the use of the RDS Aurora Serverless service.

What is Amazon Aurora Serverless?

Since last spring, Amazon unveiled a new database related product: RDS Aurora Serverless. The aim of this new product is to simplify the management around Aurora clusters. It brings a likely benefit for the end users, better control over cost. Here are some of the benefits we can expect from this product:

  • Automatic scaling up
  • Automatic scaling down
  • Automatic shutdown after a period of inactivity
  • Automatic startup

The database is constantly monitored and if the load grows beyond a given threshold, a bigger Aurora instance is added to the cluster, the connections are moved and the old instance is dropped. The opposite steps happen when a low load is detected. Also, if the database is completely inactive for some time, it is automatically stopped and restarted when needed. The RDS Aurora Serverless cluster type is available for MySQL (5.6 and 5.7) and PostgreSQL (10.12).

Architecture

The RDS Aurora Serverless architecture is similar to the regular RDS Aurora one.  There are three main components; a proxy layer handling the endpoints, the servers processing the queries, and the storage.  The proxy layer and the storage are about the same. As the name implies, what is dynamic with the Aurora Serverless type are the servers.

There are not many details available as to how things are actually implemented but likely but the proxy layer is able to transfer a connection from one server to another when there is a scale up or down event. Essentially, we can assume that when the cluster is modified, the steps are the following:

  1. A new Aurora server instance is created with the new size
  2. The new instance is added to the Aurora cluster
  3. The writer role is transferred to the new instance
  4. The existing connections are moved
  5. The old instance is removed


How To Configure It

The configuration of an RDS Aurora Serverless cluster is very similar to a regular Aurora cluster, there are just a few additional steps.  First, of course, you need to choose the serverless type:

RDS Aurora Serverless cluster

And then you have to specify the limits of your cluster in “Capacity”. The capacity unit is ACU which stands for Aurora Capacity Unit. I couldn’t find the exact meaning for the ACU, the documentation has: “Each ACU is a combination of processing and memory capacity.”. An ACU seems to provide about 2GB of RAM and the range of possible values is 1 to 256. You set the minimum and maximum ACU you want for the cluster in the following dialog box:

Aurora Capacity Unit

The last step is to specify the inactivity timeout after which the database is paused:

specify the inactivity timeout

How It Works

Startup

If the Aurora Serverless cluster has no running server instances, an attempt to connect to the database will trigger the creation of a new instance.  This process takes some time.  I used a simple script to measure the connection time after an inactivity timeout and found the following statistics:

Min = 31s
Max = 54s
average = 42s
StdDev = 7.1s
Count = 17

You’ll need to make sure the application is aware of a new connection, as the database can take close to a minute to complete.  I got caught a few times with sysbench timing out after 30s. It is important to remember the initial capacity used is the same as the one when the Aurora Serverless instance stopped, unless you enabled the “Force scaling the capacity…” parameter in the configuration.

Pause

If an Aurora Serverless cluster is idle for more than its defined inactivity time, it will be automatically paused.  The inactivity here is defined in terms of active connections, not queries. An idle connection doing nothing will prevent the Aurora Serverless instance from stopping. If you intend to use the automatic pause feature, I recommend setting the “wait_timeout” and “interactive_timeout” to values in line with the cluster inactivity time.

Scale Up

A process monitors the Aurora Serverless instance and if it sees a performance issue that could be solved by the use of a larger instance type, it triggers a scale up event.  When there is an ongoing scale up (or down) event, you’ll see a process like this one in the MySQL process list:

call action start_seamless_scaling('AQEAAEgBh893wRScvsaFbDguqAqinNK7...

Bear in mind a scale up event can take some time, especially if the server is very busy. While doing some benchmarks, I witness more than 200s on a few occasions. The queries load is affected for a few seconds when the instances are swapped.

To illustrate the scale up behavior, I ran a modified sysbench benchmark to force some CPU load. Here’s a 32 threads benchmarks scanning a table on an Aurora Serverless cluster having an initial capacity of 1.

Aurora Serverless sysbench benchmark

The first scale up happened a little after 600s while the second one occurred around 1100s. The second event didn’t improve much the load but that is likely an artifact of the benchmark. It took a long time to increase the capacity from 1 to 2, it could be related to the high CPU usage on the instance. There is usually a small disruption of the query load when the instances are swapped but nothing too bad.

Scale Down

While scale up events happen when needed, scale down events are throttled to about once per 5 minutes except if the previous scaling event was a “scale up”, then the delay is 15 minutes.

Pros and Cons of Aurora Serverless

The RDS Aurora Serverless offering is very compelling for many use cases. It reduces the cost and simplifies the management. However, you must accept the inherent limitations like the long start up time when the instance was on pause and the small hiccups when the capacity is modified. If you cannot cope with the start up time, you can just configure the instance so it doesn’t pause, it will scale down to a capacity of 1 which seems to map to a t3.small instance type.

Of course, such an architecture imposes some drawbacks. Here’s a list of a few cons:

  • As we have seen, the scale up time is affected by the database load
  • Failover can also take more time than normally expected, especially if the ACU value is high
  • You are limited to one node although, at an ACU of 256, it means a db.r4.16xlarge
  • No public IP but you can set up a Data API
  • The application must be robust in the way it deals with database connections because of possible delays and reconnections

Cost Savings

The cost of an RDS Aurora cluster has three components: the instance costs, the IO costs, and the storage costs. The Aurora Serverless offering affects only the instance costs. The cost is a flat rate per capacity unit per hour. Like for the normal instances, the costs are region-dependent.  The lowest is found in the us-east at $0.06 USD per Capacity unit per hour.

If we consider a database used by web developers during the day and which can be paused out of the normal work hours and during the weekends, the saving can be above $240/month if the daily average capacity is only eight hours.

Jul
17
2019
--

Assessing MySQL Performance Amongst AWS Options – Part One

MySQL Performance on AWS

With such a wide range of options available for running MySQL based servers in Amazon cloud environments, how do you choose? There’s no doubt it’s a challenge. In this two-part series of blog posts, we’ll try to draw a fair and informative comparison based on well-established benchmark scenarios – at scale.

In part one we will discuss the performance of the current Amazon RDS services – Amazon Aurora and Amazon RDS for MySQL – and compare it with the performance of Percona Server with InnoDB and RocksDB engines. And in part two we will go over costs and efficiencies to look for. All this information is necessarily number-heavy, but hopefully, you’ll enjoy the experiments!

Evaluation scenario

The benchmark scripts

For these evaluations, we use the sysbench/tpcc LUA test with a scale factor of 500 warehouses/10 tables. This is the equivalent of 5000 warehouses of the official TPC-C benchmark.

Amazon MySQL Environments

These are the AWS MySQL environments under analysis:

  • Amazon RDS Aurora
  • Amazon RDS for MySQL with the InnoDB storage engine
  • Percona Server for MySQL with the InnoDB storage engine on Amazon EC2
  • Percona Server for MySQL with the RocksDB storage engine on Amazon EC2

Technical Setup – Server

These general notes apply across the board:

  • AWS region us-east-1(N.Virginia) was used for all tests
  • Server and client instances were spawned in the same availability zone
  • All data for tests were prepared in advance, stored as snapshots, and restored before the test
  • Encryption was not used

And we believe that these configuration notes allow for a fair comparison of the different technologies:

  • AWS EBS optimization was enabled for EC2 instances
  • For RDS/Amazon Aurora only a primary DB instance was created and used
  • In the case of RDS/MySQL, a single AZ deployment was used for RDS/MySQL
  • EC2/Percona Server for MySQL tests were run with binary log enabled

Finally, here are the individual server configurations per environment:

Server test #1: Amazon RDS Aurora

  • Database server: Aurora MySQL 5.7
  • DB instances: r5.large, r5.xlarge, r5.2xlarge, r5.4xlarge
  • volume: used ~450GB(>15000 IOPS)

Server test #2: Amazon RDS for MySQL with InnoDB Storage Engine

  • Database server: MySQL Server 5.7.25
  • RDS instances: db.m5.large, db.m5.xlarge, db.m5.2xlarge, db.m5.4xlarge
  • volumes(allocated space):
    • gp2: 5400GB(~16000 IOPs)
    • io1: 700GB(15000 IOPs)

Server test #3: Percona Server for MySQL with InnoDB Storage Engine

  • Database server: Percona Server 5.7.25
  • EC2 instances: m5.large, m5.xlarge, m5.2xlarge, m5.4xlarge
  • volumes(allocated space):
    • gp2: 5400GB(~16000 IOPs)
    • io1: 700GB(15000 IOPs)

Server test #4: Percona Server for MySQL with RocksDB using LZ4 compression

  • Database server: Percona Server 5.7.25
  • EC2 instances: m5.large, m5.xlarge, m5.2xlarge, m5.4xlarge
  • volumes(allocated space):
    • gp2: 5400GB(~16000 IOPs)
    • io1: 350GB(15000 IOPs)

Technical Setup – Client

Common to all tests, we used an EC2 instance: m5.xlarge

So, now that we have established the setup, let’s take a look at what we found.

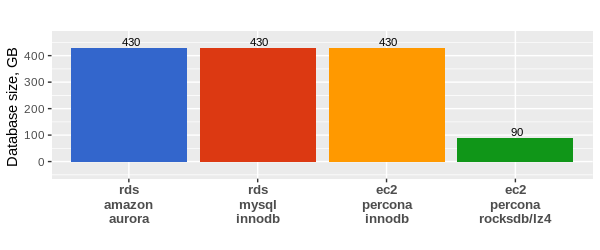
Disk space consumption for sysbench/tpcc 5000 warehouses

Since disk space costs money, you’d want to see how the raw data occupied space in each environment. There’s a clear “winner” there: Percona Server for MySQL with RocksDB storage engine. Of course, there are lots more factors to consider. 
MySQL Performance Amongst AWS

The performance tests

For the performance tests, we used this set up as common to all:

  • number of threads: 128
  • duration of each test run: 30 mins

Then, per server, we worked through individual tests as follows:

Server tests

Server test #1: RDS/Amazon Aurora

  • create cluster
  • restore cluster instance from db snapshot

Server test #2: RDS/MySQL

  • restore instance from db snapshot

Server tests #3 and #4: Percona Server for MySQL on EC2

  • create EC2 instance as server
  • create volume from snapshot and attach to server instance

Client test

  • create EC2 instance as client
  • start test

Throughput

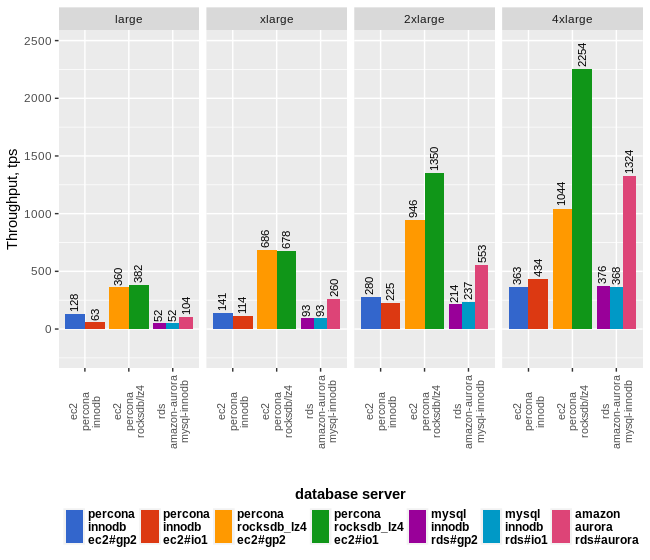
First of all, then, let’s review throughput results for every tested database. In case things aren’t complicated enough, at this stage we’re also taking into account whether io1 or gp2 volume type has an effect on the outcomes. AWS offers this comparison of io1 and gp2.

MySQL Performance AWS Options

Server test #1: RDS/Amazon Aurora

Aurora scales almost linearly from large to 4xlarge, notably outperforms Percona Server/InnoDB and RDS/MySQL but still behind RocksDB more than 2x times

Server test #2: RDS/MySQL

  • for all types of instances, we saw almost no difference in results between io1 and gp2 volumes
  • in these tests, RDS/MySQL shows the lowest throughput from all databases

Server test #3: Percona Server for MySQL with InnoDB 

  • up to 4xlarge instance results for gp2 volume slightly better(~10%) than for io1. On 4xlarge instance where the size of instance allows having a large enough innodb buffer pool that from one side helps to reduce the amount of reads as a notable amount of data will be already cached and from other side that helps to improve writing/flushing. As and in case of RocksDB it looks like writes operations are much more efficient(better latency) on io1 volumes and that helps to get better results with io1 volumes.
  • overall results for Percona Server/InnoDB is on 10-15% better than for RDS/MySQL but notably lower than for RDS/Aurora (in 2x-2.5x times) and RocksDB(5x times)

Server test #4: Percona Server for MySQL with RocksDB

  • large/xlarge – results are on par for gp2 and io1 volumes, starting from 2xlarge instance results with io1 volume continue scales linearly while gp2 stays almost on the same level
  • RockDB shows best results across all types of instances and outperforms Percona Server/InnoDB and RDS/MySQL in 5x times and RDS/Aurora 2-2.5 times

In the next post in this series, I will take a look at the total cost of one test run for each database, as well as review which databases perform most efficiently by analysis transaction cost ratio.

May
30
2019
--

Percona Monitoring and Management (PMM) 2 Beta Is Now Available

Percona Monitoring and Management

Percona Monitoring and Management

We are pleased to announce the release of PMM 2 Beta!  PMM (Percona Monitoring and Management) is a free and open-source platform for managing and monitoring MySQL, MongoDB, and PostgreSQL performance.

  • Query Analytics:
    • MySQL and MongoDB – Slow log, PERFORMANCE_SCHEMA, and Profiler data sources
    • Support for large environments – default view all queries from all instances
    • Filtering – display only the results matching filters such as the schema name or the server instance
    • Sorting and more columns – now sort by any column.
    • Modify Columns – Add one or more columns for any field exposed by the data source
    • Sparklines –  restyled sparkline targeted at making data representation more accurate
  • Labels – Prometheus now supports auto-discovered and custom labels
  • Inventory Overview Dashboard – Displays the agents, services, and nodes which are registered with PMM Server
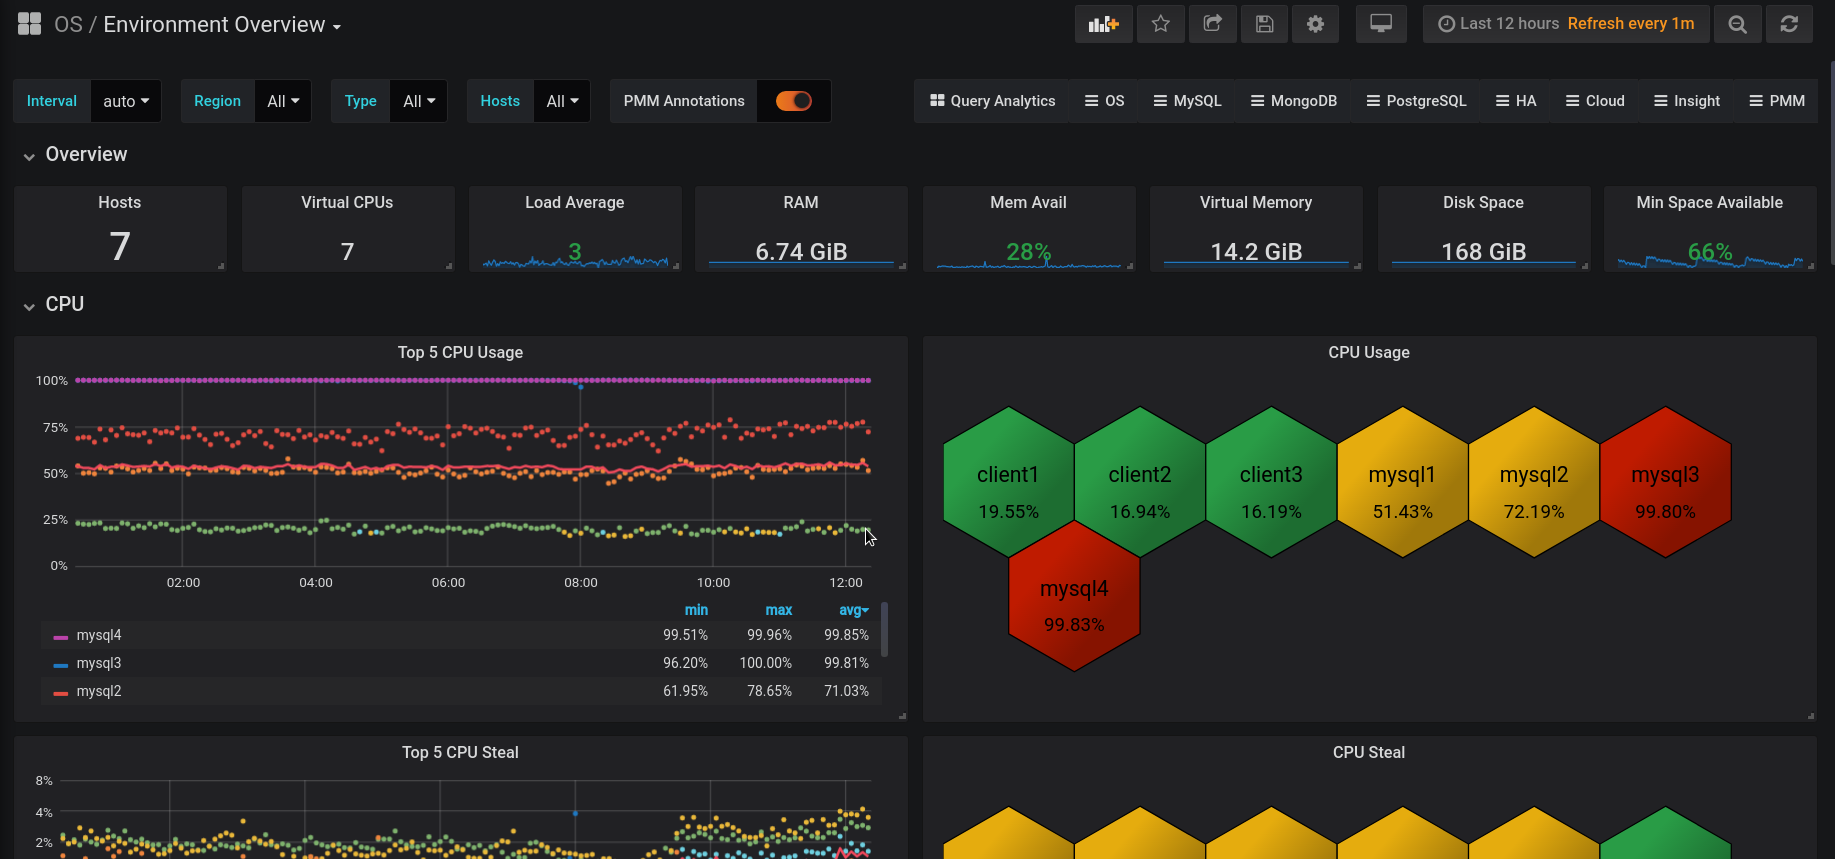
  • Environment Overview Dashboard – See issues at a glance across multiple servers
  • API – View versions and list hosts using the API
  • MySQL, MongoDB, and PostgreSQL Metrics – Visualize database metrics over time
  • pmm-agent – Provides secure remote management of the exporter processes and data collectors on the client

PMM 2 Beta is still a work in progress – you may encounter some bugs and missing features. We are aware of a number of issues, but please report any and all that you find to Percona’s JIRA.

This release is not recommended for Production environments.

PMM 2 is designed to be used as a new installation – please don’t try to upgrade your existing PMM 1 environment.

Query Analytics Dashboard

Query Analytics Dashboard now defaults to display all queries on each of the systems that are configured for MySQL PERFORMANCE_SCHEMA, Slow Log, and MongoDB Profiler, and includes comprehensive filtering capabilities.

Query Analytics Overview

You’ll recognize some of the common elements in PMM 2 Query Analytics such as the Load, Count, and Latency columns. However, there are new elements such as the filter box and more arrows on the columns:

Query Detail

Query Analytics continues to deliver detailed information regarding individual query performance

Filter and Search By

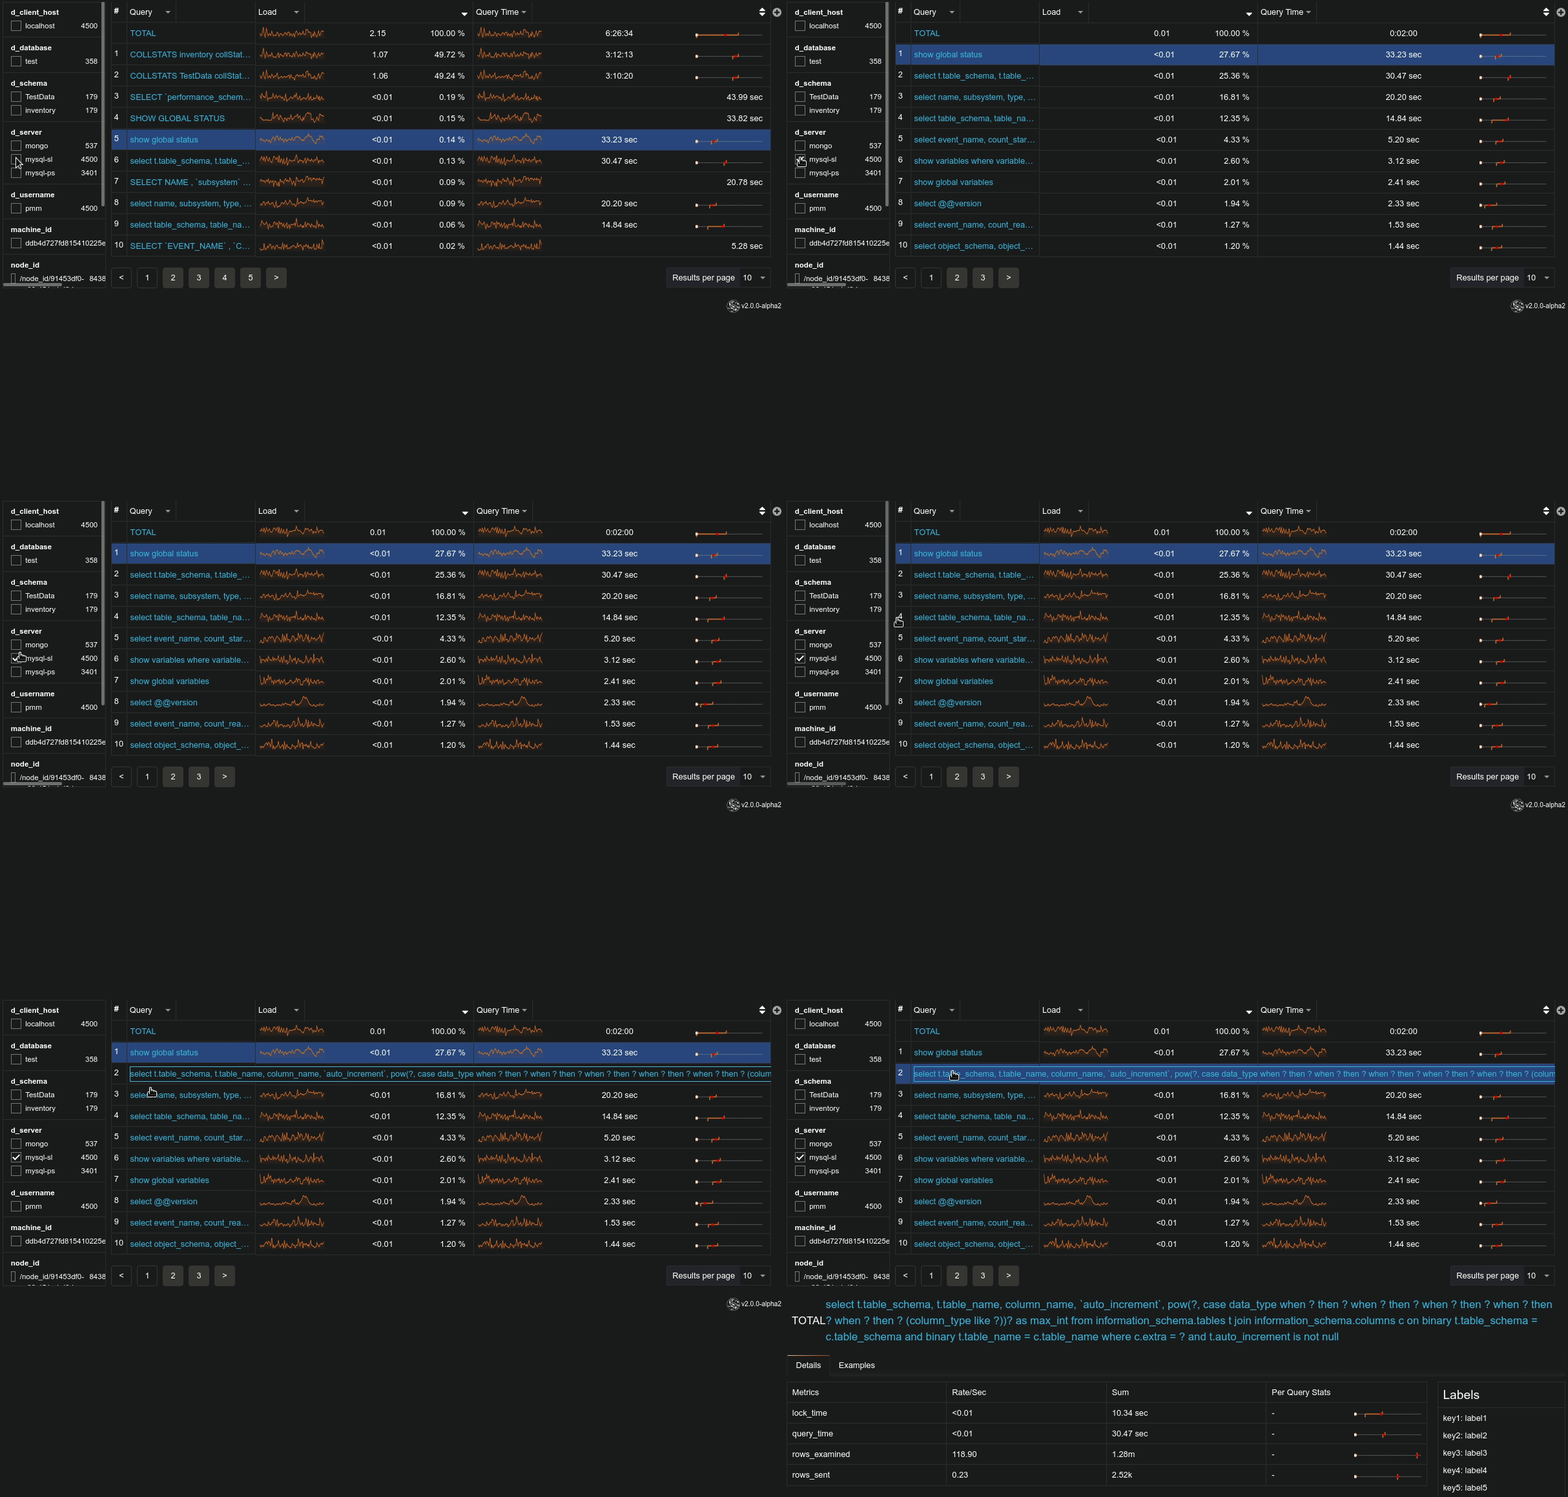
There is a filtering panel on the left, or use the search by bar to set filters using key:value syntax. For example, I’m interested in just the queries related to mysql-sl2 server, I could then type d_server:mysql-sl2:

Sort by any column

This is a much-requested feature from PMM Query Analytics and we’re glad to announce that you can now sort by any column! Just click the small arrow to the right of the column name and:

Sparklines

As you may have already noticed, we have changed the sparkline representation. New sparklines are not points-based lines, but are interval-based, and look like a staircase line with flat values for each of the displayed period:

We also position a single sparkline for only the left-most column and render numeric values for all remaining columns.

Add extra columns

Now you can add a column for each additional field which is exposed by the data source. For example, you can add Rows Examined by clicking the + sign and typing or selecting from the available list of fields:

MySQL Query Analytics Slow Log source

We’ve increased our MySQL support to include both PERFORMANCE_SCHEMA and Slow log – and if you’re using Percona Server with the Extended Slow Log format, you’ll be able to gain deep insight into the performance of individual queries, for example, InnoDB behavior.  Note the difference between the detail available from PERFORMANCE_SCHEMA vs Slow Log:

PERFORMANCE_SCHEMA:

Slow Log:

MongoDB Metrics

Support for MongoDB Metrics included in this release means you can add a local or remote MongoDB instance to PMM 2 and take advantage of the following view of MongoDB performance:

PostgreSQL Metrics

In this release, we’re also including support for PostgreSQL Metrics. We’re launching PMM 2 Beta with just the PostgreSQL Overview dashboard, but we have others under development, so watch for new Dashboards to appear in subsequent releases!

Environment Overview Dashboard

This new dashboard provides a bird’s-eye view, showing a large number of hosts at once. It allows you to easily figure out the hosts which have issues, and move onto other dashboards for a deeper investigation.

The charts presented show the top five hosts by different parameters:

The eye-catching colored hexagons with statistical data show the current values of parameters and allow you to drill-down to a dashboard which has further details on a specific host.

Labels

An important concept we’re introducing in PMM 2 is that when a label is assigned it is persisted in both the Metrics (Prometheus) and Query Analytics (Clickhouse) databases. So, when you browse a target in Prometheus you’ll notice many more labels appear – particularly the auto-discovered (replication_set, environment, node_name, etc.) and (soon to be released) custom labels via custom_label.

Inventory Dashboard

We’ve introduced a new dashboard with several tabs so that users are better able to understand which nodes, agents, and services are registered against PMM Server. We have an established hierarchy with Node at the top, then Service and Agents assigned to a Node.

  • Nodes – Where the service and agents will run. Assigned a node_id, associated with a machine_id (from /etc/machine-id)

    • Examples: bare metal, virtualized, container
  • Services – Individual service names and where they run, against which agents will be assigned. Each instance of a service gets a service_id value that is related to a node_id
    • Examples: MySQL, Amazon Aurora MySQL
    • You can also use this feature to support multiple mysqld instances on a single node, for example: mysql1-3306, mysql1-3307
  • Agents – Each binary (exporter, agent) running on a client will get an agent_id value
    • pmm-agent is the top of the tree, assigned to a node_id
    • node_exporter is assigned to pmm-agent agent_id
    • mysqld_exporter and QAN MySQL Perfschema are assigned to a service_id
    • Examples: pmm-agent, node_exporter, mysqld_exporter, QAN MySQL Perfschema

You can now see which services, agents, and nodes are registered with PMM Server.

Nodes

In this example I have PMM Server (docker) running on the same virtualized compute instance as my Percona Server 5.7 instance, so PMM treats this as two different nodes.

Services

Agents

For a monitored Percona Server instance, you’ll see an agent for each of these:

  1. pmm-agent
  2. node_exporter
  3. mysqld_exporter
  4. QAN Perfschema

API

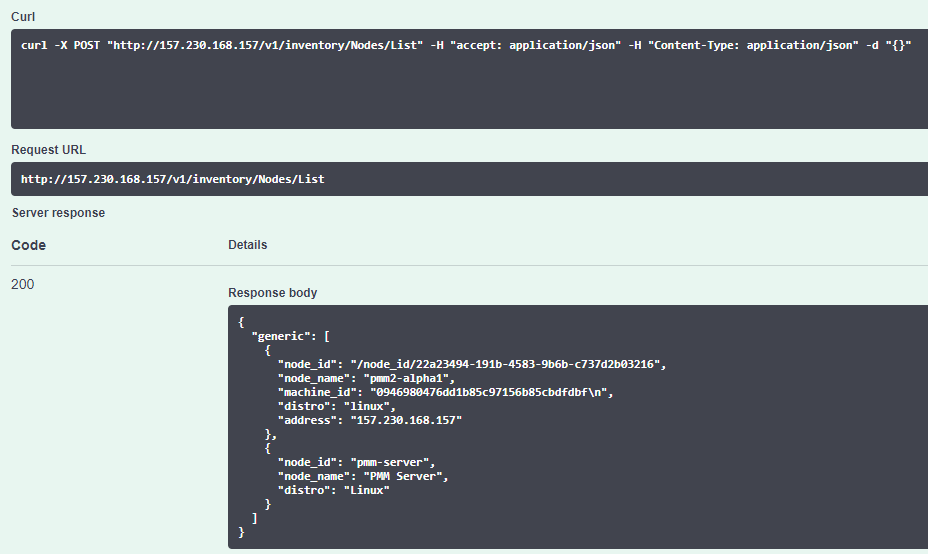
We are exposing an API for PMM Server! You can view versions, list hosts, and more…

The API is not guaranteed to work until GA release – so be prepared for some errors during Beta release.

Browse the API using Swagger at /swagger

Installation and configuration

The default PMM Server credentials are:

username: admin
password: admin

Install PMM Server with docker

The easiest way to install PMM Server is to deploy it with Docker. Running the PMM 2 Docker container with PMM Server can be done by the following commands (note the version tag of 2.0.0-beta1):

docker create -v /srv --name pmm-data-2-0-0-beta1 perconalab/pmm-server:2.0.0-beta1 /bin/true
docker run -d -p 80:80 -p 443:443 --volumes-from pmm-data-2-0-0-beta1 --name pmm-server-2.0.0-beta1 --restart always perconalab/pmm-server:2.0.0-beta1

Install PMM Client

Since PMM 2 is still not GA, you’ll need to leverage our experimental release of the Percona repository. You’ll need to download and install the official percona-release package from Percona, and use it to enable the Percona experimental component of the original repository. See percona-release official documentation for further details on this new tool.

Specific instructions for a Debian system are as follows:

wget https://repo.percona.com/apt/percona-release_latest.generic_all.deb
sudo dpkg -i percona-release_latest.generic_all.deb

Now enable the experimental repo:

sudo percona-release disable all
sudo percona-release enable original experimental

Install pmm2-client package:

apt-get update
apt-get install pmm2-client

Users who have previously installed pmm2-client alpha version should remove the package and install a new one in order to update to beta1.

Please note that leaving experimental repository enabled may affect further package installation operations with bleeding edge software that may not be suitable for Production. You can revert by disabling experimental via the following commands:

sudo percona-release disable original experimental
sudo apt-get update

Configure PMM

Once PMM Client is installed, run the pmm-admin config command with your PMM Server IP address to register your Node:

# pmm-admin config --server-insecure-tls --server-address=<IP Address>:443

You should see the following:

Checking local pmm-agent status...
pmm-agent is running.
Registering pmm-agent on PMM Server...
Registered.
Configuration file /usr/local/percona/pmm-agent.yaml updated.
Reloading pmm-agent configuration...
Configuration reloaded.

Adding MySQL Metrics and Query Analytics

MySQL server can be added for the monitoring in its normal way. Here is a command which adds it using the PERFORMANCE_SCHEMA source:

sudo pmm-admin add mysql --use-perfschema --username=pmm --password=pmm

where username and password are credentials for accessing MySQL.

The syntax to add MySQL services (Metrics and Query Analytics) using the Slow Log source is the following:

sudo pmm-admin add mysql --use-slowlog --username=pmm --password=pmm

When the server is added, you can check your MySQL dashboards and Query Analytics in order to view its performance information!

Adding MongoDB Metrics and Query Analytics

You can add MongoDB services (Metrics and Query Analytics) with a similar command:

pmm-admin add mongodb --use-profiler --use-exporter  --username=pmm  --password=pmm

Adding PostgreSQL monitoring service

You can add PostgreSQL service as follows:

pmm-admin add postgresql --username=pmm --password=pmm

You can then check your PostgreSQL Overview dashboard.

About PMM

Percona Monitoring and Management (PMM) is a free and open-source platform for managing and monitoring MySQL®, MongoDB®, and PostgreSQL® performance. You can run PMM in your own environment for maximum security and reliability. It provides thorough time-based analysis for MySQL®, MongoDB®, and PostgreSQL® servers to ensure that your data works as efficiently as possible.

Help us improve our software quality by reporting any Percona Monitoring and Management bugs you encounter using our bug tracking system.

May
03
2019
--

Percona Monitoring and Management (PMM) 2.0.0-alpha2 Is Now Available

Percona Monitoring and Management

Percona Monitoring and Management

We are pleased to announce the launch of PMM 2.0.0-alpha2, Percona’s second Alpha release of our long-awaited PMM 2 project! In this release, you’ll find support for MongoDB Metrics and Query Analytics – watch for sharp edges as we expect to find a lot of bugs!  We’ve also expanded our existing support of MySQL from our first Alpha to now include MySQL Slow Log as a data source for Query Analytics, which enhances the Query Detail section to include richer query metadata.

  • MongoDB Metrics – You can now launch PMM 2 against MongoDB and gather metrics and query data!
  • MongoDB Query Analytics – Data source from MongoDB Profiler is here!
  • MySQL Query Analytics
    • Queries source – MySQL Slow Log is here!
    • Sorting and more columns – fixed a lot of bugs around UI

PMM 2 is still a work in progress – expect to see bugs and other missing features! We are aware of a number of issues, but please report any and all that you find to Percona’s JIRA.

This release is not recommended for Production environments. PMM 2 Alpha is designed to be used as a new installation – please don’t try to upgrade your existing PMM 1 environment.

MongoDB Query Analytics

We’re proud to announce support for MongoDB Query Analytics in PMM 2.0.0-alpha2!

Using filters you can drill down on specific servers (and other fields):

MongoDB Metrics

In this release we’re including support for MongoDB Metrics, which means you can add a local or remote MongoDB instance to PMM 2 and take advantage of the following view of MongoDB performance:

MySQL Query Analytics Slow Log source

We’ve rounded out our MySQL support to include Slow log – and if you’re using Percona Server with the Extended Slow Log format, you’ll be able to gain deep insight into the performance of individual queries, for example, InnoDB behavior.  Note the difference between the detail available from PERFORMANCE_SCHEMA vs Slow Log:

PERFORMANCE_SCHEMA:

Slow Log:

Installation and configuration

The default PMM Server credentials are:

username: admin
password: admin

Install PMM Server with docker

The easiest way to install PMM Server is to deploy it with Docker. You can run a PMM 2 Docker container with PMM Server by using the following commands (note the version tag of 2.0.0-alpha2):

docker create -v /srv --name pmm-data-2-0-0-alpha2 perconalab/pmm-server:2.0.0-alpha2 /bin/true
docker run -d -p 80:80 -p 443:443 --volumes-from pmm-data-2-0-0-alpha2 --name pmm-server-2.0.0-alpha2 --restart always perconalab/pmm-server:2.0.0-alpha2

Install PMM Client

Since PMM 2 is still not GA, you’ll need to leverage our experimental release of the Percona repository. You’ll need to download and install the official percona-release package from Percona, and use it to enable the Percona experimental component of the original repository.  See percona-release official documentation for further details on this new tool.

Specific instructions for a Debian system are as follows:

wget https://repo.percona.com/apt/percona-release_latest.generic_all.deb
sudo dpkg -i percona-release_latest.generic_all.deb

Now enable the correct repo:

sudo percona-release disable all
sudo percona-release enable original experimental

Now install the pmm2-client package:

apt-get update
apt-get install pmm2-client

Users who have previously installed pmm2-client alpha1 version should remove the package and install a new one in order to update to alpha2.

Please note that having experimental packages enabled may affect further packages installation with versions which are not ready for production. To avoid this, disable this component with the following commands:

sudo percona-release disable original experimental
sudo apt-get update

Configure PMM

Once PMM Client is installed, run the pmm-admin setup command with your PMM Server IP address to register your Node within the Server:

# pmm-agent setup --server-insecure-tls --server-address=<IP Address>:443

We will be moving this functionality back to pmm-admin config in a subsequent Alpha release.

You should see the following:

Checking local pmm-agent status...
pmm-agent is running.
Registering pmm-agent on PMM Server...
Registered.
Configuration file /usr/local/percona/pmm-agent.yaml updated.
Reloading pmm-agent configuration...
Configuration reloaded.

Adding MySQL Metrics and Query Analytics (Slow Log source)

The syntax to add MySQL services (Metrics and Query Analytics) using the new Slow Log source:

sudo pmm-admin add mysql --use-slowlog --username=pmm --password=pmm

where username and password are credentials for accessing MySQL.

Adding MongoDB Metrics and Query Analytics

You can add MongoDB services (Metrics and Query Analytics) with the following command:

pmm-admin add mongodb --use-profiler --use-exporter  --username=pmm  --password=pmm

You can then check your MySQL and MongoDB dashboards and Query Analytics in order to view your server’s performance information!

We hope you enjoy this release, and we welcome your comments on the blog!

About PMM

Percona Monitoring and Management (PMM) is a free and open-source platform for managing and monitoring MySQL®, MongoDB®, and PostgreSQL performance. You can run PMM in your own environment for maximum security and reliability. It provides thorough time-based analysis for MySQL®, MongoDB®, and PostgreSQL® servers to ensure that your data works as efficiently as possible.

Help us improve our software quality by reporting any Percona Monitoring and Management bugs you encounter using our bug tracking system.

Apr
24
2019
--

Percona Monitoring and Management (PMM) 2.0.0-alpha1 Is Now Available

Percona Monitoring and Management 1.17.0

Percona Monitoring and Management

We are pleased to announce the launch of PMM 2.0.0-alpha1, Percona’s first Alpha release of our long-awaited PMM 2 project! We focused exclusively on MySQL support in our first Alpha (because we wanted to show progress sooner rather than later), and you’ll find updated MySQL dashboards along with enhancements to Query Analytics. We’ve also added better visibility regarding which services are registered with PMM Server, the client-side addition of a new agent called pmm-agent, and finally PMM Server is now exposing an API!

  • Query Analytics
    • Support for large environments – default view all queries from all instances
    • Filtering – display only the results matching filters – MySQL schema name, MySQL server instance
    • Sorting and more columns – now sort by any visible column. Add a column for any field exposed by the data source, for example add rows_examined, lock_time to your Overview
    • Queries source – MySQL PERFORMANCE SCHEMA (slow log coming in our next alpha around May 1st, 2019)
  • Labels – Prometheus now supports auto-discovered and custom labels
  • Inventory Overview Dashboard – Displays the agents, services, and nodes which are registered with PMM Server
  • API – View versions and list hosts using the API
  • pmm-agent – Provides secure remote management of the exporter processes and data collectors on the client

PMM 2 is still a work in progress – expect to see bugs and other missing features! We are aware of a number of issues, but please report any and all that you find to Percona’s JIRA.

Query Analytics Dashboard

Query Analytics Dashboard now defaults to display all queries on each of the systems that are configured for MySQL PERFORMANCE_SCHEMA, Slow Log, and MongoDB Profiler (this release includes support for MySQL PERFORMANCE SCHEMA only), and includes comprehensive filtering capabilities.

Query Analytics Overview

You’ll recognize some of the common elements in PMM 2 Query Analytics such as the Load, Count, and Latency columns, however there are new elements such as the filter box and more arrows on the columns which will be described further down:

PMM 2.0 has new elements available for reporting

Query Detail

Query Analytics continues to deliver detailed information regarding individual query performance:

PMM provides detailed query analytics for MySQL and MongoDB

Filter and Search By

Filtering panel on the left, or use the search by bar to set filters using key:value syntax, for example, I’m interested in just the queries that are executed in MySQL schema db3, I could then type d_schema:db3:

filtering panel on Percona Monitoring and Management

Sort by any column

This is a much requested feature from PMM Query Analytics and we’re glad to announce that you can sort by any column! Just click the small arrow to the right of the column name and

You can now sort PMM reports by any column

Add extra columns

Now you can add a column for each additional field which is exposed by the data source. For example you can add Rows Examined by clicking the + sign and typing or selecting from the available list of fields:

Add custom columns to your PMM presentations

Labels

An important concept we’re introducing in PMM 2 is that when a label is assigned it is persisted in both the Metrics (Prometheus) and Query Analytics (Clickhouse) databases.  So when you browse a target in Prometheus you’ll notice many more labels appear – particularly the auto-discovered (replication_set, environment, node_name, etc.) and (soon to be released) custom labels via custom_label.

Labels are reused in both QAN and Metrics

Inventory Dashboard

We’ve introduced a new dashboard with several tabs so that users are better able to understand which nodes, agents, and services are registered against PMM Server.  We have an established hierarchy with Node at the top, then Service and Agents assigned to a Node.

  • Nodes – Where the service and agents will run. Assigned a node_id, associated with a machine_id (from /etc/machine-id)
    • Examples: bare metal, virtualized, container
  • Services – Individual service names and where they run, against which agents will be assigned. Each instance of a service gets a service_id value that is related to a node_id
    • Examples: MySQL, Amazon Aurora MySQL
    • You can also use this feature to support multiple mysqld instances on a single node, for example: mysql1-3306, mysql1-3307
  • Agents – Each binary (exporter, agent) running on a client will get an agent_id value
    • pmm-agent is the top of the tree, assigned to a node_id
    • node_exporter is assigned to pmm-agent agent_id
    • mysqld_exporter & QAN MySQL Perfschema are assigned to a service_id
    • Examples: pmm-agent, node_exporter, mysqld_exporter, QAN MySQL Perfschema

You can now see which services, agents, and nodes are registered with PMM Server.

Nodes

In this example I have PMM Server (docker) running on the same virtualized compute instance as my Percona Server 5.7 instance, so PMM treats this as two different nodes.

Server treated as reporting node

Services

This example has two MySQL services configured:

Multiple database services supported by PMM

Agents

For a monitored Percona Server instance, you’ll see an agent for each of:

  1. pmm-agent
  2. node_exporter
  3. mysqld_exporter
  4. QAN Perfschema

Showing monitoring of Percona Server with an agent for each in PMM


QAN agent for Percona Server

Query Analytics Filters

Query Analytics now provides you with the opportunity to filter based on labels. We’ are beginning with labels that are sourced from MySQL Performance Schema, but eventually will include all fields from MySQL Slow Log, MongoDB Profiler, and PostgreSQL views.  We’ll also be offering the ability to set custom key:value pairs which you’ll use when setting up a new service or instance with pmm-admin during the add ... routine.

Available Filters

We’re exposing four new filters in this release, and we show where we source them from and what they mean:

Filter name Source Notes
d_client_host MySQL Slow Log MySQL PERFORMANCE_SCHEMA doesn’t include client host, so this field will be empty
d_username MySQL Slow Log MySQL PERFORMANCE_SCHEMA doesn’t include username, so this field will be empty
d_schema MySQL Slow Log

MySQL Perfschema

MySQL Schema name
d_server MySQL Slow Log

MySQL Perfschema

MySQL server instance


API

We are exposing an API for PMM Server! You can view versions, list hosts, and more!

The API is not guaranteed to work until we get to our GA release – so be prepared for breaking changes during our Alpha and Beta releases.

Browse the API using Swagger at /swagger


Installation and configuration

Install PMM Server with docker

The easiest way to install PMM Server is to deploy it with Docker. You can run a PMM 2 Docker container with PMM Server by using the following commands (note the version tag of 2.0.0-alpha1):

docker create -v /srv --name pmm-data-2-0-0-alpha1 perconalab/pmm-server:2.0.0-alpha1 /bin/true
docker run -d -p 80:80 -p 443:443 --volumes-from pmm-data-2-0-0-alpha1 --name pmm-server-2.0.0-alpha1 --restart always perconalab/pmm-server:2.0.0-alpha1

Install PMM Client

Since PMM 2 is still not GA, you’ll need to leverage our experimental release of the Percona repository. You’ll need to download and install the official percona-release package from Percona, and use it to enable the Percona experimental component of the original repository. Specific instructions for a Debian system are as follows:

wget https://repo.percona.com/apt/percona-release_latest.generic_all.deb
sudo dpkg -i percona-release_latest.generic_all.deb

Now enable the correct repo:

sudo percona-release disable all
sudo percona-release enable original experimental

Now install the pmm2-client package:

apt-get update
apt-get install pmm2-client

See percona-release official documentation for details.

Here are the default login credentials:

username: admin
password: admin

Please note that having experimental packages enabled may affect further packages installation with versions which are not ready for production. To avoid this, disable this component with the following commands:

sudo percona-release disable original experimental
sudo apt-get update

Configure PMM

Once PMM Client is installed, run the pmm-admin setup command with your PMM Server IP address to register your Node within the Server:

# pmm-agent setup --server-insecure-tls --server-address=<IP Address>:443

We will be moving this functionality back to pmm-admin config in a subsequent Alpha release.

You should see the following:

Checking local pmm-agent status...
pmm-agent is running.
Registering pmm-agent on PMM Server...
Registered.
Configuration file /usr/local/percona/pmm-agent.yaml updated.
Reloading pmm-agent configuration...
Configuration reloaded.

You then add MySQL services (Metrics and Query Analytics) with the following command:

# pmm-admin add mysql --use-perfschema --username=pmm --password=pmm

where username and password are credentials for the monitored MySQL access, which will be used locally on the database host.

After this you can view MySQL metrics or examine the added node on the new PMM Inventory Dashboard:

You can then check your MySQL dashboards and Query Analytics in order to view your server’s performance information!

We hope you enjoy this release, and we welcome your comments on the blog!

About PMM

Percona Monitoring and Management (PMM) is a free and open-source platform for managing and monitoring MySQL®, MongoDB®, and PostgreSQL performance. You can run PMM in your own environment for maximum security and reliability. It provides thorough time-based analysis for MySQL®, MongoDB®, and PostgreSQL® servers to ensure that your data works as efficiently as possible.

Help us improve our software quality by reporting any Percona Monitoring and Management bugs you encounter using our bug tracking system.

Mar
05
2019
--

How to Upgrade Amazon Aurora MySQL from 5.6 to 5.7

Over time, software evolves and it is important to stay up to date if you want to benefit from new features and performance improvements.  Database engines follow the exact same logic and providers are always careful to provide an easy upgrade path. With MySQL, the mysql_upgrade tool serves that purpose.

A database upgrade process becomes more challenging in a managed environment like AWS RDS where you don’t have shell access to the database host and don’t have access to the SUPER MySQL privilege. This post is a collaboration between Fattmerchant and Percona following an engagement focused on the upgrade of the Fattmerchant database from Amazon Aurora MySQL 5.6 to Amazon Aurora MySQL 5.7. Jacques Fu, the CTO of Fattmerchant, is the co-author of this post.  Our initial plan was to follow a path laid out previously by others but we had difficulties finding any complete and detailed procedure outlining the steps. At least, with this post, there is now one.

Issues with the regular upgrade procedure

How do we normally upgrade a busy production server with minimal downtime?  The simplest solution is to use a slave server with the newer version. Such a procedure has the side benefit of providing a “staging” database server which can be used to test the application with the new version. Basically we need to follow these steps:

  1. Enable replication on the old server
  2. Make a consistent backup
  3. Restore the backup on a second server with the newer database version – it can be a temporary server
  4. Run mysql_upgrade if needed
  5. Configure replication with the old server
  6. Test the application against the new version. If the tests includes conflicting writes, you may have to jump back to step 3
  7. If tests are OK and the new server is in sync, replication wise, with the old server, stop the application (only for a short while)
  8. Repoint the application to the new server
  9. Reset the slave
  10. Start the application

If the new server was temporary, you’ll need to repeat most of the steps the other way around, this time starting from the new server and ending on the old one.

What we thought would be a simple task turned out to be much more complicated. We were preparing to upgrade our database from Amazon Aurora MySQL 5.6 to 5.7 when we discovered that there was no option for an in-place upgrade. Unlike a standard AWS RDS MySQL (RDS MySQL upgrade 5.6 to 5.7) at the time of this article you cannot perform an in-place upgrade or even restore a backup across the major versions of Amazon Aurora MySQL.

We initially chose Amazon Aurora for the benefits of the tuning work that AWS provided out of the box, but we realized with any set of pros there comes a list of cons. In this case, the limitations meant that something that should have been straightforward took us off the documented path.

Our original high-level plan

Since we couldn’t use an RDS snapshot to provision a new Amazon Aurora MySQL 5.7 instance, we had to fallback to the use of a logical backup. The intended steps were:

  1. Backup the Amazon Aurora MySQL 5.6 write node with mysqldump
  2. Spin up an empty Amazon Aurora MySQL 5.7 cluster
  3. Restore the backup
  4. Make the Amazon Aurora MySQL 5.7 write node a slave of the Amazon Aurora MySQL 5.6 write node
  5. Once in sync, transfer the application to the Amazon Aurora MySQL 5.7 cluster

Even those simple steps proved to be challenging.

Backup of the Amazon Aurora MySQL 5.6 cluster

First, the Amazon Aurora MySQL 5.6 write node must generate binary log files. The default cluster parameter group that is generated when creating an Amazon Aurora instance does not enable these settings. Our 5.6 write node was not generating binary log files, so we copied the default cluster parameter group to a new “replication” parameter group and changed the “binlog_format” variable to MIXED.  The parameter is only effective after a reboot, so overnight we rebooted the node. That was a first short downtime.

At that point, we were able to confirm, using “show master status;” that the write node was indeed generating binlog files.  Since our procedure involves a logical backup and restore, we had to make sure the binary log files are kept for a long enough time. With a regular MySQL server the variable “expire_logs_days” controls the binary log files retention time. With RDS, you have to use the mysql.rds_set_configuration. We set the retention time to two weeks:

CALL mysql.rds_set_configuration('binlog retention hours', 336);

You can confirm the new setting is used with:

CALL mysql.rds_show_configuration;

For the following step, we needed a mysqldump backup along with its consistent replication coordinates. The option

--master-data

   of mysqldump implies “Flush table with read lock;” while the replication coordinates are read from the server.  A “Flush table” requires the SUPER privilege and this privilege is not available in RDS.

Since we wanted to avoid downtime, it is out of question to pause the application for the time it would take to backup 100GB of data. The solution was to take a snapshot and use it to provision a temporary Amazon Aurora MySQL 5.6 cluster of one node. As part of the creation process, the events tab of the AWS console will show the binary log file and position consistent with the snapshot, it looks like this:

Consistent snapshot replication coordinates

Consistent snapshot replication coordinates

From there, the temporary cluster is idle so it is easy to back it up with mysqldump. Since our dataset is large we considered the use of MyDumper but the added complexity was not worthwhile for a one time operation. The dump of a large database can take many hours. Essentially we performed:

mysqldump -h entrypoint-temporary-cluster -u awsrootuser -pxxxx \
 --no-data --single-transaction -R -E -B db1 db2 db3 > schema.sql
mysqldump -h entrypoint-temporary-cluster -nt --single-transaction \
 -u awsrootuser -pxxxx -B db1 db2 db3 | gzip -1 > dump.sql.gz
pt-show-grants -h entrypoint-temporary-cluster -u awsrootuser -pxxxx > grants.sql

The schema consist of three databases: db1, db2 and db3.  We have not included the mysql schema because it will cause issues with the new 5.7 instance. You’ll see why we dumped the schema and the data separately in the next section.

Restore to an empty Amazon Aurora MySQL 5.7 cluster

With our backup done, we are ready to spin up a brand new Amazon Aurora MySQL 5.7 cluster and restore the backup. Make sure the new Amazon Aurora MySQL 5.7 cluster is in a subnet with access to the Amazon Aurora MySQL 5.6 production cluster. In our schema, there a few very large tables with a significant number of secondary keys. To speed up the restore, we removed the secondary indexes of these tables from the schema.sql file and created a restore-indexes.sql file with the list of alter table statements needed to recreate them. Then we restored the data using these steps:

cat grants.sql | mysql -h entrypoint-new-aurora-57 -u awsroot -pxxxx
cat schema-modified.sql | mysql -h entrypoint-new-aurora-57 -u awsroot -pxxxx
zcat dump.sql.gz | mysql -h entrypoint-new-aurora-57 -u awsroot -pxxxx
cat restore-indexes.sql | mysql -h entrypoint-new-aurora-57 -u awsroot -pxxxx

Configure replication

At this point, we have a new Amazon Aurora MySQL 5.7 cluster provisioned with a dataset at a known replication coordinates from the Amazon Aurora MySQL 5.6 production cluster.  It is now very easy to setup replication. First we need to create a replication user in the Amazon Aurora MySQL 5.6 production cluster:

GRANT REPLICATION CLIENT, REPLICATION SLAVE ON *.* TO 'repl_user'@'%' identified by 'agoodpassword';

Then, in the new Amazon Aurora MySQL 5.7 cluster, you configure replication and start it by:

CALL mysql.rds_set_external_master ('mydbcluster.cluster-123456789012.us-east-1.rds.amazonaws.com', 3306,
  'repl_user', 'agoodpassword', 'mysql-bin-changelog.000018', 65932380, 0);
CALL mysql.rds_start_replication;

The endpoint mydbcluster.cluster-123456789012.us-east-1.rds.amazonaws.com points to the Amazon Aurora MySQL 5.6 production cluster.

Now, if everything went well, the new Amazon Aurora MySQL 5.7 cluster will be actively syncing with its master, the current Amazon Aurora MySQL 5.6 production cluster. This process can take a significant amount of time depending on the write load and the type of instance used for the new cluster. You can monitor the progress with the show slave status\G command, the Seconds_Behind_Master will tell you how far behind in seconds the new cluster is compared to the old one.  It is not a measurement of how long it will take to resync.

You can also monitor throughput using the AWS console. In this screenshot you can see the replication speeding up over time before it peaks when it is completed.

Replication speed

Test with Amazon Aurora MySQL 5.7

At this point, we have an Amazon Aurora MySQL 5.7 cluster in sync with the production Amazon Aurora MySQL 5.6 cluster. Before transferring the production load to the new cluster, you need to test your application with MySQL 5.7. The easiest way is to snapshot the new Amazon Aurora MySQL 5.7 cluster and, using the snapshot, provision a staging Amazon Aurora MySQL 5.7 cluster. Test your application against the staging cluster and, once tested, destroy the staging cluster and any unneeded snapshots.

Switch production to the Amazon Aurora MySQL 5.7 cluster

Now that you have tested your application with the staging cluster and are satisfied how it behaves with Amazon Aurora MySQL 5.7, the very last step is to migrate the production load. Here are the last steps you need to follow:

  1. Make sure the Amazon Aurora MySQL 5.7 cluster is still in sync with the Amazon Aurora MySQL 5.6 cluster
  2. Stop the application
  3. Validate the Show master status; of the 5.6 cluster is no longer moving
  4. Validate from the Show slave status\G in the 5.7 cluster the Master_Log_File and Exec_Master_Log_Pos match the output of the “Show master status;” from the 5.6 cluster
  5. Stop the slave in the 5.7 cluster with CALL mysql.rds_stop_replication;
  6. Reset the slave in the 5.7 cluster with CALL mysql.rds_reset_external_master;
  7. Reconfigure the application to use the 5.7 cluster endpoint
  8. Start the application

The application is down from steps 2 to 8.  Although that might appear to be a long time, these steps can easily be executed within a few minutes.

Summary

So, in summary, although RDS Aurora doesn’t support an in place upgrade between Amazon Aurora MySQL 5.6 and 5.7, there is a possible migration path, minimizing downtime.  In our case, we were able to limit the downtime to only a few minutes.

Co-Author: Jacques Fu, Fattmerchant


Jacques is CTO and co-founder at the fintech startup Fattmerchant, author of Time Hacks, and co-founder of the Orlando Devs, the largest developer meetup in Orlando. He has a passion for building products, bringing them to market, and scaling them.

Mar
04
2019
--

Upcoming Webinar Wed 3/6: MySQL High Availability and Disaster Recovery

MySQL High Availability and Disaster Recovery Webinar

MySQL High Availability and Disaster Recovery WebinarJoin Percona CEO Peter Zaitsev as he presents MySQL High Availability and Disaster Recovery on Wednesday, March 6th, 2019, at 11:00 AM PST (UTC-8) / 2:00 PM EST (UTC-5).

Register Now

In this hour-long webinar, Peter describes the differences between high availability (HA) and disaster recovery (DR). Afterward, Peter will go through scenarios detailing how each is handled manually and in Amazon RDS.

He will review the pros and cons of managing HA and DR in the traditional database environment as well in the cloud. Having full control of these areas is daunting. However, Amazon RDS makes meeting these needs easier and more efficient.

Regardless of which path you choose, monitoring your environment is vital. Peter’s talk will make that message clear. A discussion of metrics you should regularly review to keep your environment working correctly and performing optimally concludes the webinar.

In order to learn more register for Peter’s webinar on MySQL High Availability and Disaster Recovery.

Feb
20
2019
--

Percona Monitoring and Management (PMM) 1.17.1 Is Now Available

Percona Monitoring and Management 1.17.0

Percona Monitoring and Management

Percona Monitoring and Management (PMM) is a free and open-source platform for managing and monitoring MySQL®, MongoDB®, and PostgreSQL performance. You can run PMM in your own environment for maximum security and reliability. It provides thorough time-based analysis for MySQL®, MongoDB®, and PostgreSQL® servers to ensure that your data works as efficiently as possible.

In this release, we are introducing support for detection of our upcoming PMM 2.0 release in order to avoid potential version conflicts in the future, as PMM 1.x will not be compatible with PMM 2.x.

Another improvement in this release is we have updated the Tooltips for Dashboard MySQL Query Response Time by providing a description of what the graphs display, along with links to related documentation resources. An example of Tooltips in action:

PMM 1.17.1 release provides fixes for CVE-2018-16492 and CVE-2018-16487 vulnerabilities, related to Node.js modules. The authentication system used in PMM is not susceptible to the attacks described in these CVE reports. PMM does not use client-side data objects to control user-access.

In release 1.17.1 we have included two improvements and fixed nine bugs.

Improvements

  • PMM-1339: Improve tooltips for MySQL Query Response Time dashboard
  • PMM-3477: Add Ubuntu 18.10 support

Fixed Bugs

  • PMM-3471: Fix global status metric names in mysqld_exporter for MySQL 8.0 compatibility
  • PMM-3400: Duplicate column in the Query Analytics dashboard Explain section
  • PMM-3353: postgres_exporter does not work with PostgreSQL 11
  • PMM-3188: Duplicate data on Amazon RDS / Aurora MySQL Metrics dashboard
  • PMM-2615: Fix wrong formatting in log which appears if pmm-qan-agent process fails to start
  • PMM-2592: MySQL Replication Dashboard shows error with multi-source replication
  • PMM-2327: Member State Uptime and Max Member Ping time charts on the MongoDB ReplSet dashboard return an error
  • PMM-955: Fix format of User Time and CPU Time Graphs on MySQL User Statistics dashboard
  • PMM-3522: CVE-2018-16492 and CVE-2018-16487

Help us improve our software quality by reporting any Percona Monitoring and Management bugs you encounter using our bug tracking system.

Jan
11
2019
--

AWS Aurora MySQL – HA, DR, and Durability Explained in Simple Terms

It’s a few weeks after AWS re:Invent 2018 and my head is still spinning from all of the information released at this year’s conference. This year I was able to enjoy a few sessions focused on Aurora deep dives. In fact, I walked away from the conference realizing that my own understanding of High Availability (HA), Disaster Recovery (DR), and Durability in Aurora had been off for quite a while. Consequently, I decided to put this blog out there, both to collect the ideas in one place for myself, and to share them in general. Unlike some of our previous blogs, I’m not focused on analyzing Aurora performance or examining the architecture behind Aurora. Instead, I want to focus on how HA, DR, and Durability are defined and implemented within the Aurora ecosystem.  We’ll get just deep enough into the weeds to be able to examine these capabilities alone.

introducing the aurora storage engine 1

Aurora MySQL – What is it?

We’ll start with a simplified discussion of what Aurora is from a very high level.  In its simplest description, Aurora MySQL is made up of a MySQL-compatible compute layer and a multi-AZ (multi availability zone) storage layer. In the context of an HA discussion, it is important to start at this level, so we understand the redundancy that is built into the platform versus what is optional, or configurable.

Aurora Storage

The Aurora Storage layer presents a volume to the compute layer. This volume is built out in 10GB increments called protection groups.  Each protection group is built from six storage nodes, two from each of three availability zones (AZs).  These are represented in the diagram above in green.  When the compute layer—represented in blue—sends a write I/O to the storage layer, the data gets replicated six times across three AZs.

Durable by Default

In addition to the six-way replication, Aurora employs a 4-of-6 quorum for all write operations. This means that for each commit that happens at the database compute layer, the database node waits until it receives write acknowledgment from at least four out of six storage nodes. By receiving acknowledgment from four storage nodes, we know that the write has been saved in at least two AZs.  The storage layer itself has intelligence built-in to ensure that each of the six storage nodes has a copy of the data. This does not require any interaction with the compute tier. By ensuring that there are always at least four copies of data, across at least two datacenters (AZs), and ensuring that the storage nodes are self-healing and always maintain six copies, it can be said that the Aurora Storage platform has the characteristic of Durable by Default.  The Aurora storage architecture is the same no matter how large or small your Aurora compute architecture is.

One might think that waiting to receive four acknowledgments represents a lot of I/O time and is therefore an expensive write operation.  However, Aurora database nodes do not behave the way a typical MySQL database instance would. Some of the round-trip execution time is mitigated by the way in which Aurora MySQL nodes write transactions to disk. For more information on exactly how this works, check out Amazon Senior Engineering Manager, Kamal Gupta’s deep-dive into Aurora MySQL from AWS re:Invent 2018.

HA and DR Options

While durability can be said to be a default characteristic to the platform, HA and DR are configurable capabilities. Let’s take a look at some of the HA and DR options available. Aurora databases are deployed as members of an Aurora DB Cluster. The cluster configuration is fairly flexible. Database nodes are given the roles of either Writer or Reader. In most cases, there will only be one Writer node. The Reader nodes are known as Aurora Replicas. A single Aurora Cluster may contain up to 15 Aurora Replicas. We’ll discuss a few common configurations and the associated levels of HA and DR which they provide. This is only a sample of possible configurations: it is not meant to represent an exhaustive list of the possible configuration options available on the Aurora platform.

Single-AZ, Single Instance Deployment

great durability with Aurora but DA and HA less so

The most basic implementation of Aurora is a single compute instance in a single availability zone. The compute instance is monitored by the Aurora Cluster service and will be restarted if the database instance or compute VM has a failure. In this architecture, there is no redundancy at the compute level. Therefore, there is no database level HA or DR. The storage tier provides the same high level of durability described in the sections above. The image below is a view of what this configuration looks like in the AWS Console.

Single-AZ, Multi-Instance

Introducing HA into an Amazon Aurora solutionHA can be added to a basic Aurora implementation by adding an Aurora Replica.  We increase our HA level by adding Aurora Replicas within the same AZ. If desired, the Aurora Replicas can be used to also service some of the read traffic for the Aurora Cluster. This configuration cannot be said to provide DR because there are no database nodes outside the single datacenter or AZ. If that datacenter were to fail, then database availability would be lost until it was manually restored in another datacenter (AZ). It’s important to note that while Aurora has a lot of built-in automation, you will only benefit from that automation if your base configuration facilitates a path for the automation to follow. If you have a single-AZ base deployment, then you will not have the benefit of automated Multi-AZ availability. However, as in the previous case, durability remains the same. Again, durability is a characteristic of the storage layer. The image below is a view of what this configuration looks like in the AWS Console. Note that the Writer and Reader are in the same AZ.

Multi-AZ Options

Partial disaster recovery with Amazon auroraBuilding on our previous example, we can increase our level of HA and add partial DR capabilities to the configuration by adding more Aurora Replicas. At this point we will add one additional replica in the same AZ, bringing the local AZ replica count to three database instances. We will also add one replica in each of the two remaining regional AZs. Aurora provides the option to configure automated failover priority for the Aurora Replicas. Choosing your failover priority is best defined by the individual business needs. That said, one way to define the priority might be to set the first failover to the local-AZ replicas, and subsequent failover priority to the replicas in the other AZs. It is important to remember that AZs within a region are physical datacenters located within the same metro area. This configuration will provide protection for a disaster localized to the datacenter. It will not, however, provide protection for a city-wide disaster. The image below is a view of what this configuration looks like in the AWS Console. Note that we now have two Readers in the same AZ as the Writer and two Readers in two other AZs.

Cross-Region Options

The three configuration types we’ve discussed up to this point represent configuration options available within an AZ or metro area. There are also options available for cross-region replication in the form of both logical and physical replication.

Logical Replication

Aurora supports replication to up to five additional regions with logical replication.  It is important to note that, depending on the workload, logical replication across regions can be notably susceptible to replication lag.

Physical Replication

Durability, High Availability and Disaster Recovery with Amazon AuroraOne of the many announcements to come out of re:Invent 2018 is a product called Aurora Global Database. This is Aurora’s implementation of cross-region physical replication. Amazon’s published details on the solution indicate that it is storage level replication implemented on dedicated cross-region infrastructure with sub-second latency. In general terms, the idea behind a cross-region architecture is that the second region could be an exact duplicate of the primary region. This means that the primary region can have up to 15 Aurora Replicas and the secondary region can also have up to 15 Aurora Replicas. There is one database instance in the secondary region in the role of writer for that region. This instance can be configured to take over as the master for both regions in the case of a regional failure. In this scenario the secondary region becomes primary, and the writer in that region becomes the primary database writer. This configuration provides protection in the case of a regional disaster. It’s going to take some time to test this, but at the moment this architecture appears to provide the most comprehensive combination of Durability, HA, and DR. The trade-offs have yet to be thoroughly explored.

Multi-Master Options

Amazon is in the process of building out a new capability called Aurora Multi-Master. Currently, this feature is in preview phase and has not been released for general availability. While there were a lot of talks at re:Invent 2018 which highlighted some of the components of this feature, there is still no affirmative date for release. Early analysis points to the feature being localized to the AZ. It is not known if cross-region Multi-Master will be supported, but it seems unlikely.

Summary

As a post re:Invent takeaway, what I learned was that there is an Aurora configuration to fit almost any workload that requires strong performance behind it. Not all heavy workloads also demand HA and DR. If this describes one of your workloads, then there is an Aurora configuration that fits your needs. On the flip side, it is also important to remember that while data durability is an intrinsic quality of Aurora, HA and DR are not. These are completely configurable. This means that the Aurora architect in your organization must put thought and due diligence into the way they design your Aurora deployment. While we all need to be conscious of costs, don’t let cost consciousness become a blinder to reality. Just because your environment is running in Aurora does not mean you automatically have HA and DR for your database. In Aurora, HA and DR are configuration options, and just like the on-premise world, viable HA and DR have additional costs associated with them.

For More Information See Also:


Dec
20
2018
--

Percona Database Performance Blog 2018 Year in Review: Top Blog Posts

Percona Database Performance Blog

Percona Database Performance BlogLet’s look at some of the most popular Percona Database Performance Blog posts in 2018.

The closing of a year lends itself to looking back. And making lists. With the Percona Database Performance Blog, Percona staff and leadership work hard to provide the open source community with insights, technical support, predictions and metrics around multiple open source database software technologies. We’ve had nearly 4 million visits to the blog in 2018: thank you! We look forward to providing you with even better articles, news and information in 2019.

As 2018 moves into 2019, let’s take a quick look back at some of the most popular posts on the blog this year.

Top 10 Most Read

These posts had the most number of views (working down from the highest):

When Should I Use Amazon Aurora and When Should I use RDS MySQL?

Now that Database-as-a-service (DBaaS) is in high demand, there is one question regarding AWS services that cannot always be answered easily : When should I use Aurora and when RDS MySQL?

About ZFS Performance

ZFS has many very interesting features, but I am a bit tired of hearing negative statements on ZFS performance. It feels a bit like people are telling me “Why do you use InnoDB? I have read that MyISAM is faster.” I found the comparison of InnoDB vs. MyISAM quite interesting, and I’ll use it in this post.

Linux OS Tuning for MySQL Database Performance

In this post we will review the most important Linux settings to adjust for performance tuning and optimization of a MySQL database server. We’ll note how some of the Linux parameter settings used OS tuning may vary according to different system types: physical, virtual or cloud.

A Look at MyRocks Performance

As the MyRocks storage engine (based on the RocksDB key-value store http://rocksdb.org ) is now available as part of Percona Server for MySQL 5.7, I wanted to take a look at how it performs on a relatively high-end server and SSD storage.

How to Restore MySQL Logical Backup at Maximum Speed

The ability to restore MySQL logical backups is a significant part of disaster recovery procedures. It’s a last line of defense.

Why MySQL Stored Procedures, Functions and Triggers Are Bad For Performance

MySQL stored procedures, functions and triggers are tempting constructs for application developers. However, as I discovered, there can be an impact on database performance when using MySQL stored routines. Not being entirely sure of what I was seeing during a customer visit, I set out to create some simple tests to measure the impact of triggers on database performance. The outcome might surprise you.

AMD EPYC Performance Testing… or Don’t get on the wrong side of SystemD

Ever since AMD released their EPYC CPU for servers I wanted to test it, but I did not have the opportunity until recently, when Packet.net started offering bare metal servers for a reasonable price. So I started a couple of instances to test Percona Server for MySQL under this CPU. In this benchmark, I discovered some interesting discrepancies in performance between  AMD and Intel CPUs when running under systemd.

Tuning PostgreSQL Database Parameters to Optimize Performance

Out of the box, the default PostgreSQL configuration is not tuned for any particular workload. Default values are set to ensure that PostgreSQL runs everywhere, with the least resources it can consume and so that it doesn’t cause any vulnerabilities. It is primarily the responsibility of the database administrator or developer to tune PostgreSQL according to their system’s workload. In this blog, we will establish basic guidelines for setting PostgreSQL database parameters to improve database performance according to workload.

Using AWS EC2 instance store vs EBS for MySQL: how to increase performance and decrease cost

If you are using large EBS GP2 volumes for MySQL (i.e. 10TB+) on AWS EC2, you can increase performance and save a significant amount of money by moving to local SSD (NVMe) instance storage. Interested? Then read on for a more detailed examination of how to achieve cost-benefits and increase performance from this implementation.

Why You Should Avoid Using “CREATE TABLE AS SELECT” Statement

In this blog post, I’ll provide an explanation why you should avoid using the CREATE TABLE AS SELECT statement. The SQL statement “create table <table_name> as select …” is used to create a normal or temporary table and materialize the result of the select. Some applications use this construct to create a copy of the table. This is one statement that will do all the work, so you do not need to create a table structure or use another statement to copy the structure.

Honorable Mention:

Is Serverless Just a New Word for Cloud-Based?

Top 10 Most Commented

These posts generated some healthy discussions (not surprisingly, this list overlaps with the first):

Posts Worth Revisiting

Don’t miss these great posts that have excellent information on important topics:

Have a great end of the year celebration, and we look forward to providing more great blog posts in 2019.

Powered by WordPress | Theme: Aeros 2.0 by TheBuckmaker.com