Jul
19
2023
--

Deploy PostgreSQL on Kubernetes Using GitOps and ArgoCD

PostgreSQL on Kubernetes using GitOps and ArgoCD

In the world of modern DevOps, deployment automation tools have become essential for streamlining processes and ensuring consistent, reliable deployments. GitOps and ArgoCD are at the cutting edge of deployment automation, making it easy to deploy complex applications and reducing the risk of human error in the deployment process. In this blog post, we will explore how to deploy the Percona Operator for PostgreSQL v2 using GitOps and ArgoCD.

deploy the Percona Operator for PostgreSQL v2 using GitOps and ArgoCD

The setup we are looking for is the following:

  1. Teams or CICD roll out the manifests to Github
  2. ArgoCD reads the changes and compares the changes to what we have in Kubernetes
  3. ArgoCD creates/modifies Percona Operator and PostgreSQL custom resources
  4. Percona Operator takes care of day-1 and day-2 operations based on the changes pushed by ArgoCD to custom resources

Prerequisites:

  1. Kubernetes cluster
  2. GitHub repository. You can find my manifests here.

Start it up

Deploy and prepare ArgoCD

ArgoCD has quite detailed documentation explaining the installation process. I did the following:

kubectl create namespace argocd
kubectl apply -n argocd -f https://raw.githubusercontent.com/argoproj/argo-cd/stable/manifests/install.yaml

Expose the ArgoCD server. You might want to use ingress or some other approach. I’m using a Load Balancer in a public cloud:

kubectl patch svc argocd-server -n argocd -p '{"spec": {"type": "LoadBalancer"}}'

Get the Load Balancer endpoint; we will use it later:

kubectl -n argocd get svc argocd-server
NAME            TYPE           CLUSTER-IP    EXTERNAL-IP      PORT(S)                      AGE
argocd-server   LoadBalancer   10.88.1.239   123.21.23.21   80:30480/TCP,443:32623/TCP   6h28m

I’m not a big fan of Web User Interfaces, so I took the path of using
argocd CLI. Install it by following the CLI installation documentation.

Retrieve the admin password to log in using the CLI:

argocd admin initial-password -n argocd

Login to the server. Use the Load Balancer endpoint from above:

argocd login 123.21.23.21

PostgreSQL

Github and manifests

Put YAML manifests into the github repository. I have two:

  1. bundle.yaml – deploys Custom Resource Definitions, Service Account, and the Deployment of the Operator
  2. argo-test.yaml – deploys the PostgreSQL Custom Resource manifest that Operator will process

There are some changes that you would need to make to ensure that ArgoCD works with Percona Operator.

Server Side sync

Percona relies on OpenAPI v3.0 validation for Custom Resources. When done properly, it increases the size of a Custom Resource Definition manifest (CRDS) in some cases. As a result, you might see the following error when you apply the bundle:

kubectl apply -f deploy/bundle.yaml
...
Error from server (Invalid): error when creating "deploy/bundle.yaml": CustomResourceDefinition.apiextensions.k8s.io "perconapgclusters.pg.percona.com" is invalid: metadata.annotations: Too long: must have at most 262144 bytes

To avoid it, use the
serverside flag. ArgoCD supports Server-Side apply. In the manifests, I added them through annotations to
CustomResourceDefinition objects:

kind: CustomResourceDefinition
metadata:
  annotations:
    ...
    argocd.argoproj.io/sync-options: ServerSideApply=true
  name: perconapgclusters.pgv2.percona.com

Phases and waves

ArgoCD comes with Phases and Waves that allow you to apply manifests and resources in them in a specific order. You should use Waves for two reasons:

  1. To deploy Operator before Percona PostgreSQL Custom Resource
  2. It is also important to delete the Custom Resource first (so perform operations in reverse order)

I added the waves through annotations to the resources.

  • All resources in bundle.yaml are assigned to wave “1”:
kind: CustomResourceDefinition
metadata:
  annotations:
    ...
    argocd.argoproj.io/sync-wave: "1"
  name: perconapgclusters.pgv2.percona.com

  • PostgreSQL Custom Resource in argo-test.yaml has wave “5”:
apiVersion: pgv2.percona.com/v2
kind: PerconaPGCluster
metadata:
  annotations:
    argocd.argoproj.io/sync-wave: "5"
  name: argo-test

The bigger the number in wave, the later the resource will be created. In our case, PerconaPGCluster resource will be created after the Custom Resource Definitions from bundle.yaml.

Deploy with ArgoCD

Create the application in ArgoCD:

argocd app create percona-pg --repo https://github.com/spron-in/blog-data.git --path gitops-argocd-postgresql --dest-server https://kubernetes.default.svc --dest-namespace default

The commands do the following:

  • Creates an application called percona-pg
  • Uses the GitHub repo and a folder in it as a source of YAML manifests
  • Uses local k8s API. It is possible to have multiple k8s clusters.
  • Deploys into default namespace

Now perform a manual sync. The command will roll out manifests:

argocd app sync percona-pg

Check for pg object in the default namespace:

kubectl get pg
NAME        ENDPOINT          STATUS   POSTGRES   PGBOUNCER   AGE
argo-test   33.22.11.44       ready    3          3           80s

Operational tasks

Now let’s say we want to change something. The change should be merged into git, and ArgoCD will detect it. The sync interval is 180 seconds by default. You can change it in argocd-cm ConfigMap if needed.

Even when ArgoCD detects the change, it marks it as out of sync. For example, I reduced the number of CPUs for pgBouncer. ArgoCD detected the change:

argocd app get percona-pg
...
2023-07-07T10:11:22+03:00  pgv2.percona.com      PerconaPGCluster             default             argo-test                                OutOfSync                       perconapgcluster.pgv2.percona.com/argo-test configured

Now I can manually sync the change again. To automate the whole flow, just set the sync policy:

argocd app set percona-pg --sync-policy automated

Now all the changes in git will be automatically synced with Kubernetes once ArgoCD detects them.

Conclusion

GitOps, combined with Kubernetes and the Percona Operator for PostgreSQL, provides a powerful toolset for rapidly deploying and managing complex database infrastructures. By leveraging automation and deployment best practices, teams can reduce the risk of human error, increase deployment velocity, and focus on delivering business value. Additionally, the ability to declaratively manage infrastructure and application state enables teams to quickly recover from outages and respond to changes with confidence.

Try out the Operator by following the quickstart guide here.   

You can get early access to new product features, invite-only ”ask me anything” sessions with Percona Kubernetes experts, and monthly swag raffles. Interested? Fill in the form at percona.com/k8s.

Percona Distribution for PostgreSQL provides the best and most critical enterprise components from the open-source community in a single distribution, designed and tested to work together.


Download Percona Distribution for PostgreSQL Today!

Jun
30
2023
--

Announcing the General Availability of Percona Operator for PostgreSQL Version 2

General Availability of Percona Operator for PostgreSQL Version 2

Percona, a leading provider of open-source database software and services, announced the general availability of Percona Operator for PostgreSQL version 2. The solution is 100% open source and automates the deployment and management of PostgreSQL clusters on Kubernetes. Percona is also offering 24/7 support and managed services for paying customers.

As more and more organizations move their workloads to Kubernetes, managing PostgreSQL clusters in this environment can be challenging. Kubernetes provides many benefits, such as automation and scalability, but it also introduces new complexities when it comes to managing databases. IT teams must ensure high availability, scalability, and security, all while ensuring that their PostgreSQL clusters perform optimally.

Percona Operator for PostgreSQL version 2 simplifies the deployment and management of PostgreSQL clusters on Kubernetes. The solution automates tasks such as scaling, backup and restore, upgrades, and more, and supports Patroni-based PostgreSQL clusters. Additionally, Percona Operator for PostgreSQL version 2 includes expanded options for customizing backup and restore operations, improved monitoring and alerting capabilities, and support for PostgreSQL 15.

For organizations that need additional support and managed services, Percona is offering 24/7 support and managed services for paying customers. This includes access to a dedicated team of PostgreSQL experts who can help with everything from installation and configuration to ongoing management and support.

Percona’s commitment to open source ensures that the Percona Operator for PostgreSQL version 2 remains a flexible and customizable solution that can be tailored to meet the unique needs of any organization.

Below you will find a short FAQ about the new operator and a comparison to version 1.x.

What is better in version 2 compared to version 1?

Architecture

Operator SDK is now used to build and package the Operator. It simplifies the development and brings more contribution friendliness to the code, resulting in better potential for growing the community. Users now have full control over Custom Resource Definitions that Operator relies on, which simplifies the deployment and management of the operator.

In version 1.x, we relied on Deployment resources to run PostgreSQL clusters, whereas in 2.0 Statefulsets are used, which are the de-facto standard for running stateful workloads in Kubernetes. This change improves the stability of the clusters and removes a lot of complexity from the Operator.

Backups

One of the biggest challenges in version 1.x is backups and restores. There are two main problems that our users faced:

  • Not possible to change the backup configuration for the existing cluster
  • Restoration from backup to the newly deployed cluster required workarounds

In this version, both these issues are fixed. In addition to that:

Operations

Deploying complex topologies in Kubernetes is not possible without affinity and anti-affinity rules. In version 1.x, there were various limitations and issues, whereas this version comes with substantial improvements that enable users to craft the topology of their choice.

Within the same cluster, users can deploy multiple instances. These instances are going to have the same data but can have different configurations and resources. This can be useful if you plan to migrate to new hardware or need to test the new topology.

Each PostgreSQL node can have sidecar containers now to provide integration with your existing tools or expand the capabilities of the cluster.

Will Percona still support v1?

Percona Operator for PostgreSQL version 1 moves to maintenance mode and will go End-of-Life after one year – June 2024. We are going to provide bug and security fixes but will not introduce new features and improvements.

Customers with a contract with Percona will still have operational support until Operator goes into EoL stage.

I’m running version 1 now; how can I upgrade to version 2?

We have prepared detailed guidelines for migrating from version 1 to version 2 with zero or minimal downtime. Please refer to our documentation.

The Percona Operator for PostgreSQL version 2 is available now, and we invite you to try it out for yourself. Whether you’re deploying PostgreSQL for the first time or looking for a more efficient way to manage your existing environment, Percona Operator for PostgreSQL has everything you need to get the job done. We look forward to seeing what you can do with it!

For more information, visit Percona Operator for PostgreSQL v2 documentation page. For commercial support, please visit our contact page.


Learn more about Percona Operator for PostgreSQL v2

May
15
2023
--

Proof of Concept: Horizontal Write Scaling for MySQL With Kubernetes Operator

horizontal write scaling kubernetes

Historically MySQL is great in horizontal READ scale. The scaling, in that case, is offered by the different number of Replica nodes, no matter if using standard asynchronous replication or synchronous replication.

However, those solutions do not offer the same level of scaling for writes operation.

Why? Because the solutions still rely on writing in one single node that works as Primary. Also, in the case of multi-Primary, the writes will be distributed by transaction. In both cases, when using virtually-synchronous replication, the process will require certification from each node and local (by node) write; as such, the number of writes is NOT distributed across multiple nodes but duplicated.

The main reason behind this is that MySQL is a relational database system (RDBMS), and any data that is going to be written in it must respect the RDBMS rules. In short, any data that is written must be consistent with the data present. To achieve that, the data needs to be checked with the existing through defined relations and constraints. This action is something that can affect very large datasets and be very expensive. Think about updating a table with millions of rows that refer to another table with another million rows.
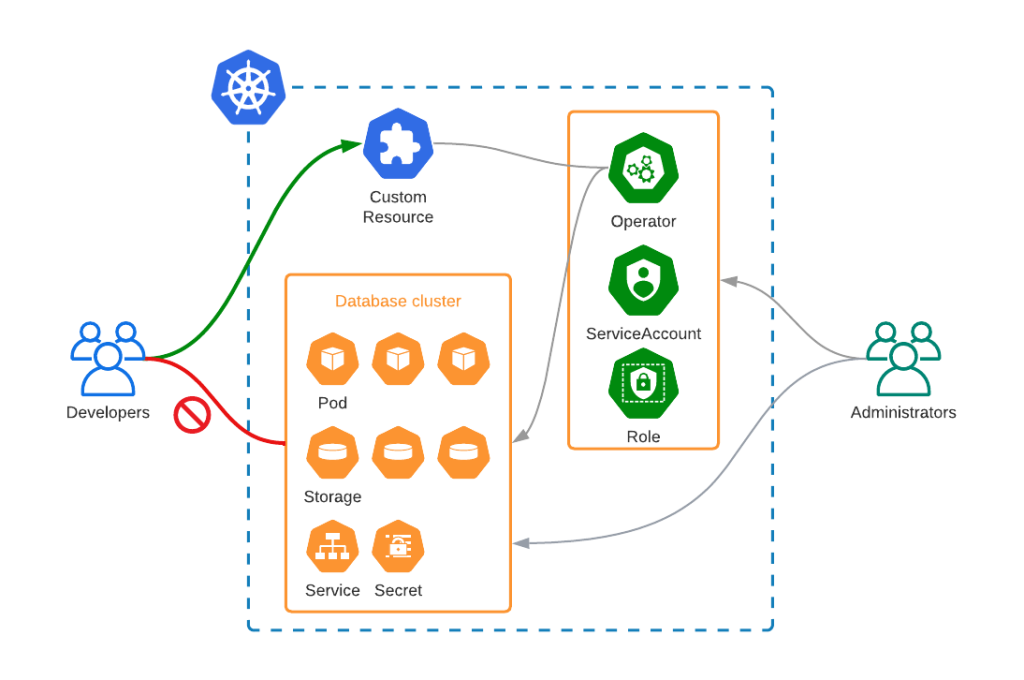
An image may help:

data model for ecommerce

Every time I will insert an order, I must be sure that all the related elements are in place and consistent.

This operation is quite expensive but our database can run it in a few milliseconds or less, thanks to several optimizations that allow the node to execute most of them in memory with no or little access to mass storage.

The key factor is that the whole data structure resides in the same location (node), facilitating the operations.

Once we have understood that, it will also become clear why we cannot have relational data split in multiple nodes and have to distribute writes by table. If I have a node that manages only the items, another one the orders, and another one the payments, I will need to have my solution able to deal with distributed transactions, each of which needs to certify and verify other nodes’ data.

This level of distribution will seriously affect the efficiency of the operation, which will increase the response time significantly. This is it. Nothing is impossible; however, the performances will be so impacted that each operation may take seconds instead of milliseconds or a fraction of it unless lifting some of the rules breaks the relational model.

MySQL, as well as other RDBMS, are designed to work respecting the model and cannot scale in any way by fragmenting and distributing a schema, so what can be done to scale?

The alternative is to split a consistent set of data into fragments. What is a consistent set of data? It all depends on the kind of information we are dealing with. Keeping in mind the example above, where we have a shop online serving multiple customers, we need to identify which is the most effective way to split the data.

For instance, if we try to split the data by Product Type (Books, CD/DVD, etc.), we will have a huge duplication of data related to customers/orders/shipments and so on, and all this data is also quite dynamic given I will have customers constantly ordering things.

Why duplicate the data? Because if I do not duplicate that data, I will not know if a customer has already bought or not that specific item, or I will have to ask again about the shipment address and so on. This also means that whenever a customer buys something or puts something on the wish list, I have to reconcile the data in all my nodes/clusters.

On the other hand, if I choose to split my data by country of customer’s residence, the only data I will have to duplicate and keep in sync is the one related to the products, of which the most dynamic one will be the number of items in stock. This, of course, is unless I can organize my products by country as well, which is a bit unusual nowadays but not impossible.

Another possible case is if I am a health organization and I manage several hospitals. As for the example above, it will be easier to split my data by hospital, given most of the data related to patients is bound to the hospital itself, as well as treatments and any other element related to hospital management. In contrast, it will make no sense to split by patient’s country of residence.

This technique of splitting the data into smaller pieces is called sharding and is currently the only way we have to scale RDBMS horizontally. 

In the MySQL open source ecosystem, we have only two consolidated ways to perform sharding — Vitess and ProxySQL. The first one is a complete solution that takes ownership of your database and manages almost any aspect of its operations in a sharded environment and includes a lot of specific features for DBAs to deal with daily operations like table modifications, backup, and more.

While this may look great, it also has some strings attached, including the complexity and proprietary environment. That makes Vitess a good fit for “complex” sharding scenarios where other solutions may not be enough.

ProxySQL does not have a sharding mechanism “per se,” but given the way it works and the features it has, it allows us to build simple sharding solutions.

It is important to note that most of the DBA operations will still be on DBA to be executed, with incremented complexity given the sharding environment.

There is a third option which is application-aware sharding.

This solution sees the application aware of the need to split the data into smaller fragments and internally point the data to different “connectors” that are connected to multiple data sources.

In this case, the application is aware of a customer’s country and will redirect all the operations related to him to the datasource responsible for the specific fragment.

Normally this solution requires a full code redesign and could be quite difficult to achieve when it is injected after the initial code architecture definition.

On the other hand, if done at design, it is probably the best solution because it will allow the application to define the sharding rules and can also optimize the different data sources using different technologies for different uses.

One example could be using an RDBMS for most of the Online transaction processing (OLTP) data shared by country and having the products as distributed memory cache with a different technology. At the same time, all the data related to orders, payments, and customer history can be consolidated in a data warehouse used to generate reporting.    

As said, the last one is probably the most powerful, scalable, and difficult to design, and unfortunately, it represents probably less than 5% of the solution currently deployed. 

As well, very few cases are in need to have a full system/solution to provide scalability with sharding.

By experience, most of the needs for horizontal scaling fell in the simple scenario, where there is the need to achieve sharding and data separation, very often with sharding-nothing architecture. In shared-nothing, each shard can live in a totally separate logical schema instance / physical database server/data center/continent. There is no ongoing need to retain shared access (from between shards) to the other unpartitioned tables in other shards.

The POC

Why this POC?

Over the years, I have faced a lot of customers talking about scaling their database solution and looking at very complex sharding as Vitess as the first and only way to go.

This without even considering if their needs were driving them there for real.

In my experience and in talking with several colleagues, I am not alone when analyzing the real needs. After discussing with all the parties impacted, only a very small percentage of customers were in real need of complex solutions. Most of the others were just trying to avoid a project that will implement simple shared-nothing solutions. Why? Because apparently, it is simpler to migrate data to a platform that does all for you than accept a bit of additional work and challenge at the beginning but keep a simple approach. Also, going for the last shining things always has its magic.

On top of that, with the rise of Kubernetes and MySQL Operators, a lot of confusion started to circulate, most of which was generated by the total lack of understanding that a database and a relational database are two separate things. That lack of understanding of the difference and the real problems attached to an RDBMS had brought some to talk about horizontal scaling for databases, with a concerning superficiality and without clarifying if they were talking about RDBMS or not. As such, some clarification is long due as well as putting back the KISS principle as the main focus.

Given that, I thought that refreshing how ProxySQL could help in building a simple sharding solution may help to clarify the issues, reset the expectations and show how we can do things in a simpler way.  (See my old post, MySQL Sharding with ProxySQL.)

To do so, I built a simple POC that illustrates how you can use Percona Operator for MySQL (POM) and ProxySQL to build a sharded environment with a good level of automation for some standard operations like backup/restore software upgrade and resource scaling.

Why ProxySQL?

In the following example, we mimic a case where we need a simple sharding solution, which means we just need to redirect the data to different data containers, keeping the database maintenance operations on us. In this common case, we do not need to implement a full sharding system such as Vitess.  

As illustrated above, ProxySQL allows us to set up a common entry point for the application and then redirect the traffic on the base of identified sharding keys. It will also allow us to redirect read/write traffic to the primary and read-only traffic to all secondaries. 

The other interesting thing is that we can have ProxySQL as part of the application pod, or as an independent service. Best practices indicate that having ProxySQL closer to the application will be more efficient, especially if we decide to activate the caching feature.  

Why POM?

Percona Operator for MySQL has three main solutions: Percona Operator for Percona XtraDB Cluster, Percona Operator for MySQL Group Replication, and Percona Operator for Percona Server for MySQL. The first two are based on virtually-synchronous replication and allow the cluster to keep the data state consistent across all pods, guaranteeing that the service will always offer consistent data. In the K8s context, we can see POM as a single service with native horizontal scalability for reads, while for writes, we will adopt the mentioned sharding approach. 

The other important aspect of using a POM-based solution is the automation it comes with. Deploying POM, you will be able to set automation for backups, software updates, monitoring (using Percona Monitoring and Management (PMM)), and last but not least, the possibility to scale UP or DOWN just by changing the needed resources. 

The elements used

kubernetes sharding

In our POC, I will use a modified version of sysbench (https://github.com/Tusamarco/sysbench) that has an additional field continent and I will use that as a sharding key. At the moment, and for the purpose of this simple POC, I will only have two shards.

As the diagram above illustrates here, we have a simple deployment but good enough to illustrate the sharding approach.

We have:

  • The application(s) node(s) — it is really up to you if you want to test with one application node or more. Nothing will change, as well as for the ProxySQL nodes, but just keep in mind that if you use more ProxySQL nodes is better to activate the internal cluster support or use consul to synchronize them.
  • Shard one is based on POM with PXC; it has the following:
  • Load balancer for service entry point
    • Entry point for r/w
    • Entry point for read only
  • Three Pods for Haproxy
    • Haproxy container
    • Pmm agent container
  • Three Pods with data nodes (PXC)
    • PXC cluster node container
    • Log streaming
    • Pmm container 
  • Backup/restore service 
  • Shard two is based on POM for Percona Server for MySQL and Group Replication (technical preview)
    • Load balancer for service entry point
      • Entry point for r/w
      • Entry point for read-only
    • Three Pods for MySQL Router (testing)
      • MySQL router container
    • Three Pods with data nodes (PS with GR)
      • PS -GR cluster node container
      • Log streaming
      • Pmm container 
    • Backup/restore on scheduler

Now you may have noticed that the representation of the nodes is different in size; this is not a mistake while drawing. It indicates that I have allocated more resources (CPU and Memory) to shard1 than shard2. Why? Because I can and I am simulating a situation where a shard2 gets less traffic, at least temporarily, as such I do not want to give it the same resources as shard1. I will eventually increase them if I see the need.

The settings

Data layer

Let us start with the easy one, the data layer configuration. Configuring the environment correctly is the key, and to do so, I am using a tool that I wrote specifically to calculate the needed configuration in a K8s POM environment. You can find it here (https://github.com/Tusamarco/mysqloperatorcalculator). 

Once you have compiled it and run it, you can simply ask what “dimensions” are supported, or you can define a custom level of resources, but you will still need to indicate the expected load level. In any case, please refer to the README in the repository with all the instructions.

The full cr.yaml for PXC shard1 is here, while the one for PS-GR is here

For Shard1: I asked for resources to cover traffic of type 2 (Light OLTP), configuration type 5 (2XLarge) 1000 connections.

For Shard2: I ask for resources to cover traffic of type 2 (Light OLTP), configuration type 2 (Small), 100 connections.     

Once you have the CRs defined, you can follow the official guidelines to set the environment up:

It is time now to see the ProxySQL settings.

ProxySQL and sharding rules

As mentioned before, we will test the load sharding by continent, and we know that ProxySQL will not provide additional help to automatically manage the sharded environment. 

Given that one way to do it is to create a DBA account per shard or to inject shard information in the commands while executing. I will use the less comfortable one just to prove if it works, the different DBA accounts. 

We will have two shards: the sharding key is the continent field, and the continents will be grouped as follows:

  • Shard one:
    • Asia
    • Africa
    • Antarctica
    • Europe
    • North America
  • Shard two:
    • Oceania
    • South America

The DBAs users:

  • dba_g1
  • dba_g2

The application user:

  • app_test

The host groups will be:

  • Shard one
    • 100 Read and Write
    • 101 Read only
  • Shard two
    • 200 Read and Write
    • 201 Read only

Once that is defined, we need to identify which query rules will serve us and how. What we want is to redirect all the incoming queries for:

  • Asia, Africa, Antarctica, Europe, and North America to shard1.
  • Oceania and South America to shard2
  • Split the queries in R/W and Read only
  • Prevent the execution of any query that does not have a shard key
  • Backup data at regular intervals and store it in a safe place

ProxySQL and sharding rules

Given the above, we first define the rules for the DBAs accounts.

We set the Hostgroup for each DBA and then if the query matches the sharding rule, we redirect it to the proper sharding. Otherwise, the HG will remain as set.

This allows us to execute queries like CREATE/DROP table on our shard without a problem but will allow us to send data where needed. 

For instance, the one below is the output of the queries that sysbench will run.

Prepare:

INSERT INTO windmills_test1 /*  continent=Asia */ (uuid,millid,kwatts_s,date,location,continent,active,strrecordtype) VALUES(UUID(), 79, 3949999,NOW(),'mr18n2L9K88eMlGn7CcctT9RwKSB1FebW397','Asia',0,'quq')

In this case, I have the application simply injecting a comment in the INSERT SQL declaring the shard key; given I am using the account dba_g1 to create/prepare the schemas, rules 32/32 will be used and given I have sett apply=1, ProxySQL will exit the query rules parsing and send the command to the relevant hostgroup.

Run:

SELECT id, millid, date,continent,active,kwatts_s FROM windmills_test1 WHERE id BETWEEN ? AND ? AND continent='South America'

SELECT SUM(kwatts_s) FROM windmills_test1 WHERE id BETWEEN ? AND ?  and active=1  AND continent='Asia'
SELECT id, millid, date,continent,active,kwatts_s  FROM windmills_test1 WHERE id BETWEEN ? AND ?  AND continent='Oceania' ORDER BY millid

SELECT DISTINCT millid,continent,active,kwatts_s   FROM windmills_test1 WHERE id BETWEEN ? AND ? AND active =1  AND continent='Oceania' ORDER BY millid

UPDATE windmills_test1 SET active=? WHERE id=?  AND continent='Asia'
UPDATE windmills_test1 SET strrecordtype=? WHERE id=?  AND continent='North America'

DELETE FROM windmills_test1 WHERE id=?  AND continent='Antarctica'

INSERT INTO windmills_test1 /* continent=Antarctica */ (id,uuid,millid,kwatts_s,date,location,continent,active,strrecordtype) VALUES (?, UUID(), ?, ?, NOW(), ?, ?, ?,?) ON DUPLICATE KEY UPDATE kwatts_s=kwatts_s+1

The above are executed during the tests.  In all of them, the sharding key is present, either in the WHERE clause OR as a comment. 

Of course, if I execute one of them without the sharding key, the firewall rule will stop the query execution, i.e.:

mysql> SELECT id, millid, date,continent,active,kwatts_s FROM windmills_test1 WHERE id BETWEEN ? AND ?;
ERROR 1148 (42000): It is impossible to redirect this command to a defined shard. Please be sure you Have the Continent definition in your query, or that you use a defined DBA account (dba_g{1/2})


Check
here for the full command list.

Setting up the dataset

Once the rules are set, it is time to set up the schemas and the data using sysbench (https://github.com/Tusamarco/sysbench). Remember to use windmills_sharding tests.  

The first operation is to build the schema on SHARD2 without filling it with data. This is a DBA action; as such, we will execute it using the dba_g2 account:

sysbench ./src/lua/windmills_sharding/oltp_read.lua  --mysql-host=10.0.1.96  --mysql-port=6033 --mysql-user=dba_g2 --mysql-password=xxx --mysql-db=windmills_large --mysql_storage_engine=innodb --db-driver=mysql --tables=4 --table_size=0 --table_name=windmills --mysql-ignore-errors=all --threads=1  prepare

Setting table_size and pointing to the ProxySQL IP/port will do, and I will have the following:

mysql> select current_user(), @@hostname;
+----------------+-------------------+
| current_user() | @@hostname        |
+----------------+-------------------+
| dba_g2@%       | ps-mysql1-mysql-0 |
+----------------+-------------------+
1 row in set (0.01 sec)

mysql> use windmills_large;
Database changed
mysql> show tables;
+---------------------------+
| Tables_in_windmills_large |
+---------------------------+
| windmills1                |
| windmills2                |
| windmills3                |
| windmills4                |
+---------------------------+
4 rows in set (0.01 sec)

mysql> select count(*) from windmills1;
+----------+
| count(*) |
+----------+
|        0 |
+----------+
1 row in set (0.09 sec)

All set but empty.

Now let us do the same but with the other DBA user:

sysbench ./src/lua/windmills_sharding/oltp_read.lua  --mysql-host=10.0.1.96  --mysql-port=6033 --mysql-user=dba_g1 --mysql-password=xxx --mysql-db=windmills_large --mysql_storage_engine=innodb --db-driver=mysql --tables=4 --table_size=400 --table_name=windmills --mysql-ignore-errors=all --threads=1  prepare

If I do now the select above with user dba_g2:

mysql> select current_user(), @@hostname;select count(*) from windmills1;
+----------------+-------------------+
| current_user() | @@hostname        |
+----------------+-------------------+
| dba_g2@%       | ps-mysql1-mysql-0 |
+----------------+-------------------+
1 row in set (0.00 sec)

+----------+
| count(*) |
+----------+
|      113 |
+----------+
1 row in set (0.00 sec)

While If I reconnect and use dba_g1:

mysql> select current_user(), @@hostname;select count(*) from windmills1;
+----------------+--------------------+
| current_user() | @@hostname         |
+----------------+--------------------+
| dba_g1@%       | mt-cluster-1-pxc-0 |
+----------------+--------------------+
1 row in set (0.00 sec)

+----------+
| count(*) |
+----------+
|      287 |
+----------+
1 row in set (0.01 sec)

I can also check on ProxySQL to see which rules were utilized:

select active,hits,destination_hostgroup, mysql_query_rules.rule_id, match_digest, match_pattern, replace_pattern, cache_ttl, apply,flagIn,flagOUT FROM mysql_query_rules NATURAL JOIN stats.stats_mysql_query_rules ORDER BY mysql_query_rules.rule_id;

+------+-----------------------+---------+---------------------+----------------------------------------------------------------------------+-------+--------+---------+
| hits | destination_hostgroup | rule_id | match_digest        | match_pattern                                                              | apply | flagIN | flagOUT |
+------+-----------------------+---------+---------------------+----------------------------------------------------------------------------+-------+--------+---------+
| 3261 | 100                   | 20      | NULL                | NULL                                                                       | 0     | 0      | 500     |
| 51   | 200                   | 21      | NULL                | NULL                                                                       | 0     | 0      | 600     |
| 2320 | 100                   | 31      | NULL                | scontinents*(=|like)s*'*(Asia|Africa|Antarctica|Europe|North America)'* | 1     | 500    | 0       |
| 880  | 200                   | 32      | NULL                | scontinents*(=|like)s*'*(Oceania|South America)'*                       | 1     | 500    | 0       |
| 0    | 100                   | 34      | NULL                | scontinents*(=|like)s*'*(Asia|Africa|Antarctica|Europe|North America)'* | 1     | 600    | 0       |
| 0    | 200                   | 35      | NULL                | scontinents*(=|like)s*'*(Oceania|South America)'*                       | 1     | 600    | 0       |
| 2    | 100                   | 51      | NULL                | scontinents*(=|like)s*'*(Asia|Africa|Antarctica|Europe|North America)'* | 0     | 0      | 1001    |
| 0    | 200                   | 54      | NULL                | scontinents*(=|like)s*'*(Oceania|South America)'*                       | 0     | 0      | 1002    |
| 0    | 100                   | 60      | NULL                | NULL                                                                       | 0     | 50     | 1001    |
| 0    | 200                   | 62      | NULL                | NULL                                                                       | 0     | 60     | 1002    |
| 7    | NULL                  | 2000    | .                   | NULL                                                                       | 1     | 0      | NULL    |
| 0    | 100                   | 2040    | ^SELECT.*FOR UPDATE | NULL                                                                       | 1     | 1001   | NULL    |
| 2    | 101                   | 2041    | ^SELECT.*$          | NULL                                                                       | 1     | 1001   | NULL    |
| 0    | 200                   | 2050    | ^SELECT.*FOR UPDATE | NULL                                                                       | 1     | 1002   | NULL    |
| 0    | 201                   | 2051    | ^SELECT.*$          | NULL                                                                       | 1     | 1002   | NULL    |
+------+-----------------------+---------+---------------------+----------------------------------------------------------------------------+-------+--------+---------+

Running the application

Now that the data load test was successful let us do the real load following the indication as above but use 80 Tables and just a bit more records like 20000, nothing huge. 

Once the data is loaded, we will have the two shards with different numbers of records. If all went well, the shard2 should have ¼ of the total and shard1 ¾.

When the load is over, I have, as expected:

mysql> select current_user(), @@hostname;select count(*) as shard1 from windmills_large.windmills80;select /* continent=shard2 */ count(*) as shard2 from windmills_large.windmills80;
+----------------+--------------------+
| current_user() | @@hostname         |
+----------------+--------------------+
| dba_g1@%       | mt-cluster-1-pxc-0 |
+----------------+--------------------+
1 row in set (0.00 sec)

+--------+
| shard1 |
+--------+
|  14272 | ← Table windmills80 in SHARD1
+--------+
+--------+
| shard2 |
+--------+
|   5728 | ← Table windmills80 in SHARD2
+--------+

As you may have already noticed, I used a trick to query the other shard using the dba_g1 user, I just passed in the query the shard2 definition as a comment. That is all we need.

Let us execute the run command for writes in sysbench and see what happens.

The first thing we can notice while doing writes is the query distribution:

+--------+-----------+----------------------------------------------------------------------------+----------+--------+----------+----------+--------+---------+-------------+---------+
| weight | hostgroup | srv_host                                                                   | srv_port | status | ConnUsed | ConnFree | ConnOK | ConnERR | MaxConnUsed | Queries |
+--------+-----------+----------------------------------------------------------------------------+----------+--------+----------+----------+--------+---------+-------------+---------+
| 10000  | 100       | ac966f7d46c04400fb92a3603f0e2634-193113472.eu-central-1.elb.amazonaws.com  | 3306     | ONLINE | 24	     | 0        | 138    | 66      | 25          | 1309353 |
| 100    | 101       | a5c8836b7c05b41928ca84f2beb48aee-1936458168.eu-central-1.elb.amazonaws.com | 3306     | ONLINE | 0	     | 0        | 0      | 0       | 0           |       0 |
| 10000  | 200       | a039ab70e9f564f5e879d5e1374d9ffa-1769267689.eu-central-1.elb.amazonaws.com | 3306     | ONLINE | 24	     | 1        | 129    | 66      | 25          |  516407 |
| 10000  | 201       | a039ab70e9f564f5e879d5e1374d9ffa-1769267689.eu-central-1.elb.amazonaws.com | 6447     | ONLINE | 0	     | 0        | 0      | 0       | 0           |       0 |
+--------+-----------+----------------------------------------------------------------------------+----------+--------+----------+----------+--------+---------+-------------+---------+

Where we can notice that the load in connection is evenly distributed, while the load is mainly going to shard1 as we expected, given we have an unbalanced sharding by design.

At the MySQL level, we had:

Questions

MySQL

Com Type

The final point is, what is the gain of using this sharding approach?

Well, we still need to consider the fact we are testing on a very small set of data. However, if we can already identify some benefits here, that will be an interesting result. 

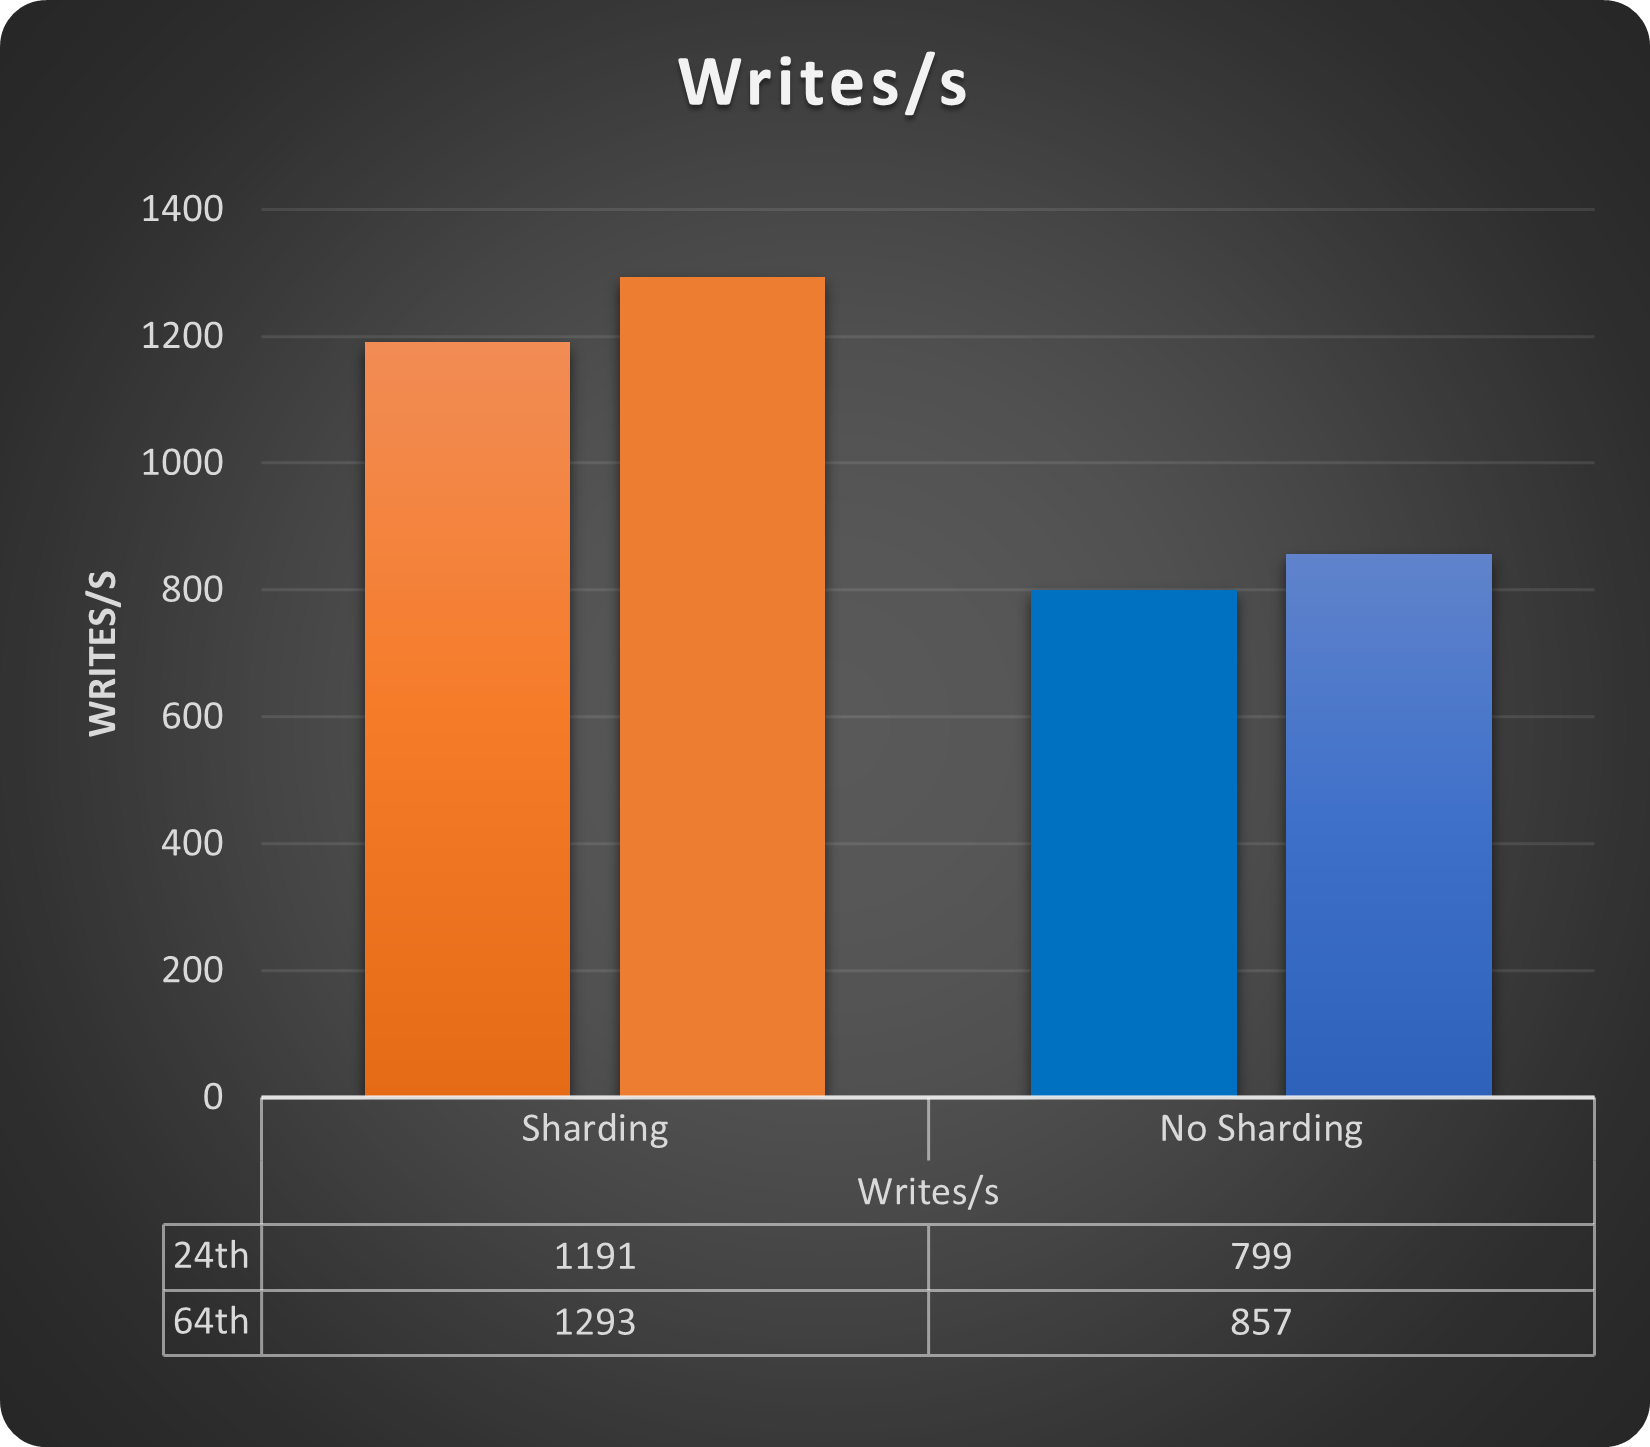
Let’s see the write operations with 24 and 64 threads:

MySQL writes

MySQL latency

We get a gain of ~33% just using sharding, while for latency, we do not have a cost. On the contrary, also with a small load increase, we can see how the sharded solution performs better. Of course, we are still talking about a low number of rows and running threads but the gain is there. 

Backup

The backup and restore operation when using POM is completely managed by the operator (see instructions in the POM documentation https://docs.percona.com/percona-operator-for-mysql/pxc/backups.html and https://docs.percona.com/percona-operator-for-mysql/ps/backups.html). 

The interesting part is that we can have multiple kinds of backup solutions, like:

  • On-demand
  • Scheduled 
  • Full Point in time recovery with log streaming

Automation will allow us to set a schedule as simple as this:

schedule:
     - name: "sat-night-backup"
        schedule: "0 0 * * 6"
        keep: 3
        storageName: s3-eu-west
      - name: "daily-backup"
        schedule: "0 3 * * *"
        keep: 7
        storageName: s3-eu-west

Or, if you want to run the on-demand:

kubectl apply -f backup.yaml

Where the backup.yaml file has very simple information:

apiVersion: ps.percona.com/v1alpha1
kind: PerconaServerMySQLBackup
metadata:
  name: ps-gr-sharding-test-2nd-of-may
#  finalizers:
#    - delete-backup
spec:
  clusterName: ps-mysql1
  storageName: s3-ondemand

Using both methods, we will be able to soon have a good set of backups like:

POM (PXC)

cron-mt-cluster-1-s3-eu-west-20234293010-3vsve   mt-cluster-1   s3-eu-west    s3://mt-bucket-backup-tl/scheduled/mt-cluster-1-2023-04-29-03:00:10-full   Succeeded   3d9h        3d9h
cron-mt-cluster-1-s3-eu-west-20234303010-3vsve   mt-cluster-1   s3-eu-west    s3://mt-bucket-backup-tl/scheduled/mt-cluster-1-2023-04-30-03:00:10-full   Succeeded   2d9h        2d9h
cron-mt-cluster-1-s3-eu-west-2023513010-3vsve    mt-cluster-1   s3-eu-west    s3://mt-bucket-backup-tl/scheduled/mt-cluster-1-2023-05-01-03:00:10-full   Succeeded   33h         33h
cron-mt-cluster-1-s3-eu-west-2023523010-3vsve    mt-cluster-1   s3-eu-west    s3://mt-bucket-backup-tl/scheduled/mt-cluster-1-2023-05-02-03:00:10-full   Succeeded   9h          9h

POM (PS) *

NAME                             STORAGE       DESTINATION                                                                     STATE       COMPLETED   AGE
ps-gr-sharding-test              s3-ondemand   s3://mt-bucket-backup-tl/ondemand/ondemand/ps-mysql1-2023-05-01-15:10:04-full   Succeeded   21h         21h
ps-gr-sharding-test-2nd-of-may   s3-ondemand   s3://mt-bucket-backup-tl/ondemand/ondemand/ps-mysql1-2023-05-02-12:22:24-full   Succeeded   27m         27m

Note that as DBA, we still need to validate the backups with a restore procedure. That part is not automated (yet). 

*Note that Backup for POM PS is available only on demand, given the solution is still in technical preview.

When will this solution fit in?

As mentioned multiple times, this solution can cover simple cases of sharding; better if you have shared-nothing. 

It also requires work from the DBA side in case of DDL operations or resharding. 

You also need to be able to change some SQL code to be sure to have present the sharding key/information in any SQL executed.

When will this solution not fit in?

Several things could prevent you from using this solution. The most common ones are:

  • You need to query multiple shards at the same time. This is not possible with ProxySQL.
  • You do not have a DBA to perform administrative work and need to rely on an automated system.
  • Distributed transaction cross-shard.
  • No access to SQL code.

Conclusions

We do not have the Amletic dilemma about sharding or not sharding. 

When using an RDBMS like MySQL, if you need horizontal scalability, you need to shard. 

The point is there is no magic wand or solution; moving to sharding is an expensive and impacting operation. If you choose it at the beginning, before doing any application development, the effort can be significantly less. 

Doing sooner will also allow you to test proper solutions, where proper is a KISS solution. Always go for the less complex things, because in two years you will be super happy about your decision.  

If, instead, you must convert a current solution, then prepare for bloodshed, or at least for a long journey. 

In any case, we need to keep in mind a few key points:

  • Do not believe most of the articles on the internet that promise you infinite scalability for your database. If there is no distinction in the article between a simple database and an RDBMS, run away. 
  • Do not go for the last shiny things just because they shine. Test them and evaluate IF it makes sense for you. Better to spend a quarter testing now a few solutions than fight for years with something that you do not fully comprehend.  
  • Using containers/operators/Kubernetes does not scale per se; you must find a mechanism to have the solution scaling. There is absolutely NO difference with premises. What you may get is a good level of automation. However, that will come with a good level of complexity, and it is up to you to evaluate if it makes sense or not.  

As said at the beginning, for MySQL, the choice is limited. Vitess is the full complete solution, with a lot of coding to provide you with a complete platform to deal with your scaling needs.

However, do not be so fast to exclude ProxySQL as a possible solution. There are out there already many using it also for sharding. 

This small POC used a synthetic case, but it also shows that with just four rules, you can achieve a decent solution. A real scenario could be a bit more complex … or not. 

References

Vitess (https://vitess.io/docs/)

ProxySQL (https://proxysql.com/documentation/)

Firewalling with ProxySQL (https://www.tusacentral.com/joomla/index.php/mysql-blogs/197-proxysql-firewalling)

Sharding:


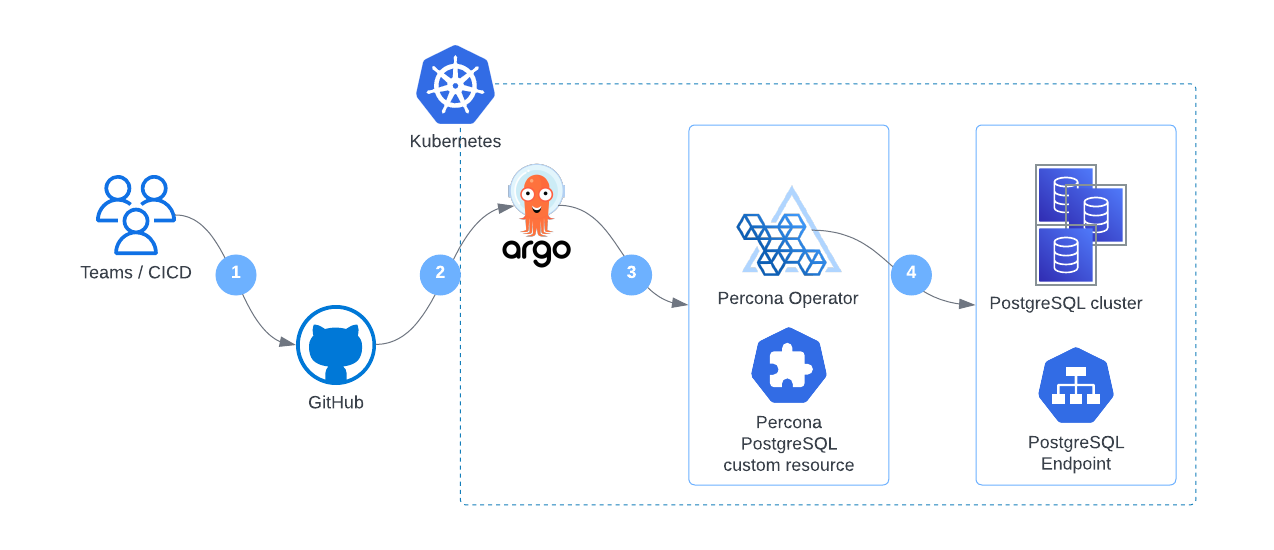
The Percona Kubernetes Operators automate the creation, alteration, or deletion of members in your Percona Distribution for MySQL, MongoDB, or PostgreSQL environment.


Learn More About Percona Kubernetes Operators

Mar
15
2023
--

Automating Physical Backups of MongoDB on Kubernetes

MongoDB

We at Percona talk a lot about how Kubernetes Operators automate the deployment and management of databases. Operators seamlessly handle lots of Kubernetes primitives and database configuration bits and pieces, all to remove toil from operation teams and provide a self-service experience for developers.

Today we want to take you backstage and show what is really happening under the hood. We will review technical decisions and obstacles we faced when implementing physical backup in Percona Operator for MongoDB version 1.14.0. The feature is now in technical preview.

The why

Percona Server for MongoDB can handle petabytes of data. The users of our Operators want to host huge datasets in Kubernetes too. However, using a logical restore recovery method takes a lot of time and can lead to SLA breaches.

Our Operator uses Percona Backup for MongoDB (PBM) as a tool to backup and restore databases. We have been leveraging logical backups for quite some time. Physical backups in PBM were introduced a few months ago, and, with those, we saw significant improvement in recovery time (read more in this blog post, Physical Backup Support in Percona Backup for MongoDB):

physical backup mongodb

So if we want to reduce the Recovery Time Objective (RTO) for big data sets, we must provide physical backups and restores in the Operator.

The how

Basics

When you enable backups in your cluster, the Operator adds a sidecar container to each replset pod (including the Config Server pods if sharding is enabled) to run pbm-agent. These agents listen for PBM commands and perform backups and restores on the pods. The Operator opens connections to the database to send PBM commands to its collections or to track the status of PBM operations.

kubernetes backup mongodb

Backups

Enabling physical backups was fairly straightforward. The Operator already knew how to start a logical backup, so we just passed a single field to the PBM command if the requested backup was physical.

Unlike logical backups, PBM needs direct access to mongod’s data directory, and we mounted the persistent volume claim (PVC) on PBM sidecar containers. With these two simple changes, the Operator could perform physical backups. But whether you know it from theory or from experience (ouch!), a backup is useless if you cannot restore it.

Restores

Enabling physical restores wasn’t easy. PBM had two major limitations when it came to physical restores:

1. PBM stops the mongod process during the restore.

2. It runs a temporary mongod process after the backup files are copied to the data directory.

What makes physical restores a complex feature is dealing with the implications of these two constraints.

PBM kills the mongod process

PBM kills the mongod process in the container, which means the operator can’t query PBM collections from the database during the restore to track their status. This forced us to use the PBM CLI tool to control the PBM operations during the physical restore instead of opening a connection to the database.

Note: We are now considering using the same approach for every PBM operation in the Operator. Let us know what you think.

Another side effect of PBM killing mongod was restarting the mongod container. The mongod process runs as PID 1 in the container, and when you kill it, the container restarts. But the PBM agent needs to keep working after mongod is killed to complete the physical restore. For this, we have created a special entrypoint to be used during the restore. This special entrypoint starts mongod and just sleeps after mongod has finished.

Temporary mongod started by PBM

When you start a physical restore, PBM does approximately the following:

1. Kills the mongod process and wipes the data directory.

2. Copies the backup files to the data directory.

3. Starts a temporary mongod process listening on a random port to perform operations on oplog.

4. Kills the mongod and PBM agent processes.

For a complete walkthrough, see Physical Backup Support in Percona Backup for MongoDB.

From the Operator’s point of view, the problem with this temporary mongod process is its version. We support MongoDB 4.4, MongoDB 5.0, and now MongoDB 6.0 in the Operator, and the temporary mongod needs to be the same version as the MongoDB running in the cluster. This means we either include mongod binary in PBM docker images and create a separate image for each version combination or find another solution.

Well… we found it: We copy the PBM binaries into the mongod container before the restore. This way, the PBM agent can kill and start the mongod process as often as it wants, and it’s guaranteed to be the same version with cluster.

Tying it all together

By now, it may seem like I have thrown random solutions to each problem. PBM, CLI, special entrypoint, copying PBM binaries… How does it all work?

When you start a physical restore, the Operator patches the StatefulSet of each replset to:

1. Switch the mongod container entrypoint to our new special entrypoint: It’ll start pbm-agent in the background and then start the mongod process. The script itself will run as PID 1, and after mongod is killed, it’ll sleep forever.

2. Inject a new init container: This init container will copy the PBM and pbm-agent binaries into the mongod container.

3. Remove the PBM sidecar: We must ensure that only one pbm-agent is running in each pod.

Until all StatefulSets (except mongos) are updated, the PerconaServerMongoDBRestore object is in a “waiting” state. Once they’re all updated, the operator starts the restore, and the restore object goes into the requested state, then the running state, and finally, the ready or error state.

Conclusion

Operators simplify the deployment and management of applications on Kubernetes. Physical backups and restores are quite a popular feature for MongoDB clusters. Restoring from physical backup with Percona Backup for MongoDB has multiple manual steps. This article shows what kind of complexity is hidden behind this seemingly simple step.


Try Percona Operator for MongoDB

Dec
15
2022
--

Least Privilege for Kubernetes Resources and Percona Operators

Operators hide the complexity of the application and Kubernetes. Instead of dealing with Pods, StatefulSets, tons of YAML manifests, and various configuration files, the user talks to Kubernetes API to provision a ready-to-use application. An Operator automatically provisions all the required resources and exposes the application. Though, there is always a risk that the user would want to do something manual that can negatively affect the application and the Operator logic.

In this blog post, we will explain how to limit access scope for the user to avoid manual changes for database clusters deployed with Percona Operators. To do so, we will rely on Kubernetes Role-based Access Control (RBAC).

The goal

We are going to have two roles: Administrator and Developer. Administrator will deploy the Operator, create necessary roles, and service accounts. Developers will be able to:

  1. Create, modify, and delete Custom Resources that Percona Operators use
  2. List all the resources – users might want to debug the issues

Developers will not be able to:

  1. Create, modify, or delete any other resource

Least Privilege for Kubernetes

As a result, the Developer will be able to deploy and manage database clusters through a Custom Resource, but will not be able to modify any operator-controlled resources, like Pods, Services, Persistent Volume Claims, etc.

Action

We will provide an example for Percona Operator for MySQL based on Percona XtraDB Cluster (PXC), which just had version 1.12.0 released

Administrator

Create a dedicated namespace

We will allow users to manage clusters in a single namespace called

prod-dbs

:

$ kubectl create namespace prod-dbs

Deploy the operator

Use any of the ways described in our documentation to deploy the operator into the namespace. My personal favorite will be with simple

kubectl

command:

$ kubectl apply -f https://raw.githubusercontent.com/percona/percona-xtradb-cluster-operator/v1.12.0/deploy/bundle.yaml

Create ClusterRole

ClusterRole resource defines the permissions the user will have for a specific resource in Kubernetes. You can find the YAML in this github repository.

    - apiGroups: ["pxc.percona.com"]
      resources: ["*"]
      verbs: ["*"]
    - apiGroups: [""]
      resources:
      - pods
      - pods/exec
      - pods/log
      - configmaps
      - services
      - persistentvolumeclaims
      - secrets
      verbs:
      - get
      - list
      - watch

As you can see we allow any operations for

pxc.percona.com

resources, but restrict others to get, list, and watch.

$ kubectl apply -f https://github.com/spron-in/blog-data/blob/master/rbac-operators/clusterrole.yaml

Create ServiceAccount

We are going to generate a kubeconfig for this service account. This is what the user is going to use to connect to the Kubernetes API.

apiVersion: v1
kind: ServiceAccount
metadata:
    name: database-manager
    namespace: prod-dbs

$ kubectl apply -f https://raw.githubusercontent.com/spron-in/blog-data/master/rbac-operators/serviceaccount.yaml

Create ClusterRoleBinding

We need to assign the

ClusterRole

to the

ServiceAccount

.

ClusterRoleBinding

 acts as a relation between these two.

$ kubectl apply -f https://github.com/spron-in/blog-data/blob/master/rbac-operators/clusterrolebinding.yaml

apiVersion: rbac.authorization.k8s.io/v1
kind: ClusterRoleBinding
metadata:
    name: percona-database-manager-bind
    namespace: prod-dbs
roleRef:
    apiGroup: rbac.authorization.k8s.io
    kind: ClusterRole
    name: percona-pxc-rbac
subjects:
    - kind: ServiceAccount
      name: database-manager
      namespace: prod-dbs

Developer

Verify

can-i

command allows you to verify if the service account can really do what we want it to do. Let’s try:

$ kubectl auth can-i create perconaxtradbclusters.pxc.percona.com --as=system:serviceaccount:prod-dbs:database-manager
yes

$ kubectl auth can-i delete service --as=system:serviceaccount:prod-dbs:database-manager
no

All good. I can create Percona XtraDB Clusters, but I can’t delete Services. Please note, that sometimes it might be useful to allow Developers to delete Pods to force the cluster recovery. If you feel that it is needed, please modify the ClusterRole.

Apply

There are multiple ways to use this service account. You can read more about it in Kubernetes documentation. For a quick demonstration, we are going to generate a kubeconfig that we can share with our user. 

Run this script to generate the config. What it does:

  1. Gets the service account secret resource name
  2. Extracts Certificate Authority (ca.crt) contents from the secret
  3. Extracts the token from the secret
  4. Gets the endpoint of the Kubernetes API
  5. Generates the kubeconfig using all of the above
$ bash generate-kubeconfig.sh > tmp-kube.config

Now let’s see if it works as expected:

$ KUBECONFIG=tmp-kube.config -n prod-dbs apply -f https://raw.githubusercontent.com/percona/percona-xtradb-cluster-operator/v1.12.0/deploy/cr.yaml
perconaxtradbcluster.pxc.percona.com/cluster1 created

$ KUBECONFIG=tmp-kube.config kubectl -n prod-dbs get pods
NAME                                               READY   STATUS    RESTARTS   AGE
cluster1-haproxy-0                                 2/2     Running   0          15m
cluster1-haproxy-1                                 2/2     Running   0          14m
cluster1-haproxy-2                                 2/2     Running   0          14m
cluster1-pxc-0                                     3/3     Running   0          15m
cluster1-pxc-1                                     3/3     Running   0          14m
cluster1-pxc-2                                     3/3     Running   0          13m
percona-xtradb-cluster-operator-77bf8b9df5-qglsg   1/1     Running   0          52m

I was able to create the Custom Resource and a cluster. Let’s try to delete the Pod:

$ KUBECONFIG=tmp-kube.config kubectl -n prod-dbs delete pods cluster1-haproxy-0
Error from server (Forbidden): pods "cluster1-haproxy-0" is forbidden: User "system:serviceaccount:prod-dbs:database-manager" cannot delete resource "pods" in API group "" in the namespace "prod-dbs"

What about the Custom Resource?

$ KUBECONFIG=tmp-kube.config kubectl -n prod-dbs delete pxc cluster1
perconaxtradbcluster.pxc.percona.com "cluster1" deleted

Conclusion

Percona Operators automate the deployment and management of the databases in Kubernetes. Least privilege principle should be applied to minimize the ability of inexperienced users to affect availability and data integrity. Kubernetes comes with sophisticated Role-Based Access Control capabilities which allow you to do just that without the need to reinvent it in your platform or application.

Try Percona Operators

May
16
2022
--

Running Rocket.Chat with Percona Server for MongoDB on Kubernetes

Running Rocket.Chat with Percona Server for MongoDB on Kubernetes

Our goal is to have a Rocket.Chat deployment which uses highly available Percona Server for MongoDB cluster as the backend database and it all runs on Kubernetes. To get there, we will do the following:

  • Start a Google Kubernetes Engine (GKE) cluster across multiple availability zones. It can be any other Kubernetes flavor or service, but I rely on multi-AZ capability in this blog post.
  • Deploy Percona Operator for MongoDB and database cluster with it
  • Deploy Rocket.Chat with specific affinity rules
    • Rocket.Chat will be exposed via a load balancer

Rocket.Chat will be exposed via a load balancer

Percona Operator for MongoDB, compared to other solutions, is not only the most feature-rich but also comes with various management capabilities for your MongoDB clusters – backups, scaling (including sharding), zero-downtime upgrades, and many more. There are no hidden costs and it is truly open source.

This blog post is a walkthrough of running a production-grade deployment of Rocket.Chat with Percona Operator for MongoDB.

Rock’n’Roll

All YAML manifests that I use in this blog post can be found in this repository.

Deploy Kubernetes Cluster

The following command deploys GKE cluster named

percona-rocket

in 3 availability zones:

gcloud container clusters create --zone us-central1-a --node-locations us-central1-a,us-central1-b,us-central1-c percona-rocket --cluster-version 1.21 --machine-type n1-standard-4 --preemptible --num-nodes=3

Read more about this in the documentation.

Deploy MongoDB

I’m going to use helm to deploy the Operator and the cluster.

Add helm repository:

helm repo add percona https://percona.github.io/percona-helm-charts/

Install the Operator into the percona namespace:

helm install psmdb-operator percona/psmdb-operator --create-namespace --namespace percona

Deploy the cluster of Percona Server for MongoDB nodes:

helm install my-db percona/psmdb-db -f psmdb-values.yaml -n percona

Replica set nodes are going to be distributed across availability zones. To get there, I altered the affinity keys in the corresponding sections of psmdb-values.yaml:

antiAffinityTopologyKey: "topology.kubernetes.io/zone"

Prepare MongoDB

For Rocket.Chat to connect to our database cluster, we need to create the users. By default, clusters provisioned with our Operator have

userAdmin

user, its password is set in

psmdb-values.yaml

:

MONGODB_USER_ADMIN_PASSWORD: userAdmin123456

For production-grade systems, do not forget to change this password or create dedicated secrets to provision those. Read more about user management in our documentation.

Spin up a client Pod to connect to the database:

kubectl run -i --rm --tty percona-client1 --image=percona/percona-server-mongodb:4.4.10-11 --restart=Never -- bash -il

Connect to the database with

userAdmin

:

[mongodb@percona-client1 /]$ mongo "mongodb://userAdmin:userAdmin123456@my-db-psmdb-db-rs0-0.percona/admin?replicaSet=rs0"

We are going to create the following:

  • rocketchat

    database

  • rocketChat

    user to store data and connect to the database

  • oplogger

    user to provide access to oplog for rocket chat

    • Rocket.Chat uses Meteor Oplog tailing to improve performance. It is optional.
use rocketchat
db.createUser({
  user: "rocketChat",
  pwd: passwordPrompt(),
  roles: [
    { role: "readWrite", db: "rocketchat" }
  ]
})

use admin
db.createUser({
  user: "oplogger",
  pwd: passwordPrompt(),
  roles: [
    { role: "read", db: "local" }
  ]
})

Deploy Rocket.Chat

I will use helm here to maintain the same approach. 

helm install -f rocket-values.yaml my-rocketchat rocketchat/rocketchat --version 3.0.0

You can find rocket-values.yaml in the same repository. Please make sure you set the correct passwords in the corresponding YAML fields.

As you can see, I also do the following:

  • Line 11: expose Rocket.Chat through
    LoadBalancer

    service type

  • Line 13-14: set number of replicas of Rocket.Chat Pods. We want three – one per each availability zone.
  • Line 16-23: set affinity to distribute Pods across availability zones

Load Balancer will be created with a public IP address:

$ kubectl get service my-rocketchat-rocketchat
NAME                       TYPE           CLUSTER-IP    EXTERNAL-IP    PORT(S)        AGE
my-rocketchat-rocketchat   LoadBalancer   10.32.17.26   34.68.238.56   80:32548/TCP   12m

You should now be able to connect to

34.68.238.56

and enjoy your highly available Rocket.Chat installation.

Rocket.Chat installation

Clean Up

Uninstall all helm charts to remove MongoDB cluster, the Operator, and Rocket.Chat:

helm uninstall my-rocketchat
helm uninstall my-db -n percona
helm uninstall psmdb-operator -n percona

Things to Consider

Ingress

Instead of exposing Rocket.Chat through a load balancer, you may also try ingress. By doing so, you can integrate it with cert-manager and have a valid TLS certificate for your chat server.

Mongos

It is also possible to run a sharded MongoDB cluster with Percona Operator. If you do so, Rocket.Chat will connect to mongos Service, instead of the replica set nodes. But you will still need to connect to the replica set directly to get oplogs.

Conclusion

We encourage you to try out Percona Operator for MongoDB with Rocket.Chat and let us know on our community forum your results.

There is always room for improvement and a time to find a better way. Please let us know if you face any issues with contributing your ideas to Percona products. You can do that on the Community Forum or JIRA. Read more about contribution guidelines for Percona Operator for MongoDB in CONTRIBUTING.md.

Percona Operator for MongoDB contains everything you need to quickly and consistently deploy and scale Percona Server for MongoDB instances into a Kubernetes cluster on-premises or in the cloud. The Operator enables you to improve time to market with the ability to quickly deploy standardized and repeatable database environments. Deploy your database with a consistent and idempotent result no matter where they are used.

May
12
2022
--

Percona Operator for MongoDB and Kubernetes MCS: The Story of One Improvement

Percona Operator for MongoDB and Kubernetes MCS

Percona Operator for MongoDB supports multi-cluster or cross-site replication deployments since version 1.10. This functionality is extremely useful if you want to have a disaster recovery deployment or perform a migration from or to a MongoDB cluster running in Kubernetes. In a nutshell, it allows you to use Operators deployed in different Kubernetes clusters to manage and expand replica sets.Percona Kubernetes Operator

For example, you have two Kubernetes clusters: one in Region A, another in Region B.

  • In Region A you deploy your MongoDB cluster with Percona Operator. 
  • In Region B you deploy unmanaged MongoDB nodes with another installation of Percona Operator.
  • You configure both Operators, so that nodes in Region B are added to the replica set in Region A.

In case of failure of Region A, you can switch your traffic to Region B.

Migrating MongoDB to Kubernetes describes the migration process using this functionality of the Operator.

This feature was released in tech preview, and we received lots of positive feedback from our users. But one of our customers raised an internal ticket, which was pointing out that cross-site replication functionality does not work with Multi-Cluster Services. This started the investigation and the creation of this ticket – K8SPSMDB-625

This blog post will go into the deep roots of this story and how it is solved in the latest release of Percona Operator for MongoDB version 1.12.

The Problem

Multi-Cluster Services or MCS allows you to expand network boundaries for the Kubernetes cluster and share Service objects across these boundaries. Someone calls it another take on Kubernetes Federation. This feature is already available on some managed Kubernetes offerings,  Google Cloud Kubernetes Engine (GKE) and AWS Elastic Kubernetes Service (EKS). Submariner uses the same logic and primitives under the hood.

MCS Basics

To understand the problem, we need to understand how multi-cluster services work. Let’s take a look at the picture below:

multi-cluster services

  • We have two Pods in different Kubernetes clusters
  • We add these two clusters into our MCS domain
  • Each Pod has a service and IP-address which is unique to the Kubernetes cluster
  • MCS introduces new Custom Resources –
    ServiceImport

    and

    ServiceExport

    .

    • Once you create a
      ServiceExport

      object in one cluster,

      ServiceImport

      object appears in all clusters in your MCS domain.

    • This
      ServiceImport

        object is in

      svc.clusterset.local

      domain and with the network magic introduced by MCS can be accessed from any cluster in the MCS domain

Above means that if I have an application in the Kubernetes cluster in Region A, I can connect to the Pod in Kubernetes cluster in Region B through a domain name like

my-pod.<namespace>.svc.clusterset.local

. And it works from another cluster as well.

MCS and Replica Set

Here is how cross-site replication works with Percona Operator if you use load balancer:

MCS and Replica Set

All replica set nodes have a dedicated service and a load balancer. A replica set in the MongoDB cluster is formed using these public IP addresses. External node added using public IP address as well:

  replsets:
  - name: rs0
    size: 3
    externalNodes:
    - host: 123.45.67.89

All nodes can reach each other, which is required to form a healthy replica set.

Here is how it looks when you have clusters connected through multi-cluster service:

Instead of load balancers replica set nodes are exposed through Cluster IPs. We have ServiceExports and ServiceImports resources. All looks good on the networking level, it should work, but it does not.

The problem is in the way the Operator builds MongoDB Replica Set in Region A. To register an external node from Region B to a replica set, we will use MCS domain name in the corresponding section:

  replsets:
  - name: rs0
    size: 3
    externalNodes:
    - host: rs0-4.mongo.svc.clusterset.local

Now our rs.status() will look like this:

"name" : "my-cluster-rs0-0.mongo.svc.cluster.local:27017"
"role" : "PRIMARY"
...
"name" : "my-cluster-rs0-1.mongo.svc.cluster.local:27017"
"role" : "SECONDARY"
...
"name" : "my-cluster-rs0-2.mongo.svc.cluster.local:27017"
"role" : "SECONDARY"
...
"name" : "rs0-4.mongo.svc.clusterset.local:27017"
"role" : "UNKNOWN"

As you can see, Operator formed a replica set out of three nodes using

svc.cluster.local

domain, as it is how it should be done when you expose nodes with

ClusterIP

Service type. In this case, a node in Region B cannot reach any node in Region A, as it tries to connect to the domain that is local to the cluster in Region A. 

In the picture below, you can easily see where the problem is:

The Solution

Luckily we have a Special Interest Group (SIG), a Kubernetes Enhancement Proposal (KEP) and multiple implementations for enabling Multi-Cluster Services. Having a KEP is great since we can be sure the implementations from different providers (i.e GCP, AWS) will follow the same standard more or less.

There are two fields in the Custom Resource that control MCS in the Operator:

spec:
  multiCluster:
    enabled: true
    DNSSuffix: svc.clusterset.local

Let’s see what is happening in the background with these flags set.

ServiceImport and ServiceExport Objects

Once you enable MCS by patching the CR with

spec.multiCluster.enabled: true

, the Operator creates a

ServiceExport

object for each service. These ServiceExports will be detected by the MCS controller in the cluster and eventually a

ServiceImport

for each

ServiceExport

will be created in the same namespace in each cluster that has MCS enabled.

As you see, we made a decision and empowered the Operator to create

ServiceExport

objects. There are two main reasons for doing that:

  • If any infrastructure-as-a-code tool is used, it would require additional logic and level of complexity to automate the creation of required MCS objects. If Operator takes care of it, no additional work is needed. 
  • Our Operators take care of the infrastructure for the database, including Service objects. It just felt logical to expand the reach of this functionality to MCS.

Replica Set and Transport Encryption

The root cause of the problem that we are trying to solve here lies in the networking field, where external replica set nodes try to connect to the wrong domain names. Now, when you enable multi-cluster and set

DNSSuffix

(it defaults to

svc.clusterset.local

), Operator does the following:

  • Replica set is formed using MCS domain set in
    DNSSuffix


  • Operator generates TLS certificates as usual, but adds
    DNSSuffix

    domains into the picture

With this approach, the traffic between nodes flows as expected and is encrypted by default.

Replica Set and Transport Encryption

Things to Consider

MCS APIs

Please note that the operator won’t install MCS APIs and controllers to your Kubernetes cluster. You need to install them by following your provider’s instructions prior to enabling MCS for your PSMDB clusters. See our docs for links to different providers.

Operator detects if MCS is installed in the cluster by API resources. The detection happens before controllers are started in the operator. If you installed MCS APIs while the operator is running, you need to restart the operator. Otherwise, you’ll see an error like this:

{
  "level": "error",
  "ts": 1652083068.5910048,
  "logger": "controller.psmdb-controller",
  "msg": "Reconciler error",
  "name": "cluster1",
  "namespace": "psmdb",
  "error": "wrong psmdb options: MCS is not available on this cluster",
  "errorVerbose": "...",
  "stacktrace": "..."
}

ServiceImport Provisioning Time

It might take some time for

ServiceImport

objects to be created in the Kubernetes cluster. You can see the following messages in the logs while creation is in progress: 

{
  "level": "info",
  "ts": 1652083323.483056,
  "logger": "controller_psmdb",
  "msg": "waiting for service import",
  "replset": "rs0",
  "serviceExport": "cluster1-rs0"
}

During testing, we saw wait times up to 10-15 minutes. If you see your cluster is stuck in initializing state by waiting for service imports, it’s a good idea to check the usage and quotas for your environment.

DNSSuffix

We also made a decision to automatically generate TLS certificates for Percona Server for MongoDB cluster with

*.clusterset.local

domain, even if MCS is not enabled. This approach simplifies the process of enabling MCS for a running MongoDB cluster. It does not make much sense to change the

DNSSuffix

 field, unless you have hard requirements from your service provider, but we still allow such a change. 

If you want to enable MCS with a cluster deployed with an operator version below 1.12, you need to update your TLS certificates to include

*.clusterset.local

SANs. See the docs for instructions.

Conclusion

Business relies on applications and infrastructure that serves them more than ever nowadays. Disaster Recovery protocols and various failsafe mechanisms are routine for reliability engineers, not an annoying task in the backlog. 

With multi-cluster deployment functionality in Percona Operator for MongoDB, we want to equip users to build highly available and secured database clusters with minimal effort.

Percona Operator for MongoDB is truly open source and provides users with a way to deploy and manage their enterprise-grade MongoDB clusters on Kubernetes. We encourage you to try this new Multi-Cluster Services integration and let us know your results on our community forum. You can find some scripts that would help you provision your first MCS clusters on GKE or EKS here.

There is always room for improvement and a time to find a better way. Please let us know if you face any issues with contributing your ideas to Percona products. You can do that on the Community Forum or JIRA. Read more about contribution guidelines for Percona Operator for MongoDB in CONTRIBUTING.md.

Apr
18
2022
--

Expose Databases on Kubernetes with Ingress

Expose Databases on Kubernetes with Ingress

Ingress is a resource that is commonly used to expose HTTP(s) services outside of Kubernetes. To have ingress support, you will need an Ingress Controller, which in a nutshell is a proxy. SREs and DevOps love ingress as it provides developers with a self-service to expose their applications. Developers love it as it is simple to use, but at the same time quite flexible.

High-level ingress design looks like this: 

High-level ingress design

  1. Users connect through a single Load Balancer or other Kubernetes service
  2. Traffic is routed through Ingress Pod (or Pods for high availability)
    • There are multiple flavors of Ingress Controllers. Some use nginx, some envoy, or other proxies. See a curated list of Ingress Controllers here.
  3. Based on HTTP headers traffic is routed to corresponding Pods which run websites. For HTTPS traffic Server Name Indication (SNI) is used, which is an extension in TLS supported by most browsers. Usually, ingress controller integrates nicely with cert-manager, which provides you with full TLS lifecycle support (yeah, no need to worry about renewals anymore).

The beauty and value of such a design is that you have a single Load Balancer serving all your websites. In Public Clouds, it leads to cost savings, and in private clouds, it simplifies your networking or reduces the number of IPv4 addresses (if you are not on IPv6 yet). 

TCP and UDP with Ingress

Quite interestingly, some ingress controllers also support TCP and UDP proxying. I have been asked on our forum and Kubernetes slack multiple times if it is possible to use ingress with Percona Operators. Well, it is. Usually, you need a load balancer per database cluster: 

TCP and UDP with Ingress

The design with ingress is going to be a bit more complicated but still allows you to utilize the single load balancer for multiple databases. In cases where you run hundreds of clusters, it leads to significant cost savings. 

  1. Each TCP port represents the database cluster
  2. Ingress Controller makes a decision about where to route the traffic based on the port

The obvious downside of this design is non-default TCP ports for databases. There might be weird cases where it can turn into a blocker, but usually, it should not.

Hands-on

My goal is to have the following:

All configuration files I used for this blog post can be found in this Github repository.

Deploy Percona XtraDB Clusters (PXC)

The following commands are going to deploy the Operator and three clusters:

kubectl apply -f https://raw.githubusercontent.com/spron-in/blog-data/master/operators-and-ingress/bundle.yaml

kubectl apply -f https://raw.githubusercontent.com/spron-in/blog-data/master/operators-and-ingress/cr-minimal.yaml
kubectl apply -f https://raw.githubusercontent.com/spron-in/blog-data/master/operators-and-ingress/cr-minimal2.yaml
kubectl apply -f https://raw.githubusercontent.com/spron-in/blog-data/master/operators-and-ingress/cr-minimal3.yaml

Deploy Ingress

helm upgrade --install ingress-nginx ingress-nginx   --repo https://kubernetes.github.io/ingress-nginx   --namespace ingress-nginx --create-namespace  \
--set controller.replicaCount=2 \
--set tcp.3306="default/minimal-cluster-haproxy:3306"  \
--set tcp.3307="default/minimal-cluster2-haproxy:3306" \
--set tcp.3308="default/minimal-cluster3-haproxy:3306"

This is going to deploy a highly available ingress-nginx controller. 

  • controller.replicaCount=2

    – defines that we want to have at least two Pods of ingress controller. This is to provide a highly available setup.

  • tcp flags do two things:
    • expose ports 3306-3308 on the ingress’s load balancer
    • instructs ingress controller to forward traffic to corresponding services which were created by Percona Operator for PXC clusters. For example, port 3307 is the one to use to connect to minimal-cluster2. Read more about this configuration in ingress documentation.

Here is the load balancer resource that was created:

$ kubectl -n ingress-nginx get service
NAME                                 TYPE           CLUSTER-IP      EXTERNAL-IP    PORT(S)                                                                   AGE
…
ingress-nginx-controller             LoadBalancer   10.43.72.142    212.2.244.54   80:30261/TCP,443:32112/TCP,3306:31583/TCP,3307:30786/TCP,3308:31827/TCP   4m13s

As you see, ports 3306-3308 are exposed.

Check the Connection

This is it. Database clusters should be exposed and reachable. Let’s check the connection. 

Get the root password for minimal-cluster2:

$ kubectl get secrets minimal-cluster2-secrets | grep root | awk '{print $2}' | base64 --decode && echo
kSNzx3putYecHwSXEgf

Connect to the database:

$ mysql -u root -h 212.2.244.54 --port 3307  -p
Enter password:
Welcome to the MySQL monitor.  Commands end with ; or \g.
Your MySQL connection id is 5722

It works! Notice how I use port 3307, which corresponds to minimal-cluster2.

Adding More Clusters

What if you add more clusters into the picture, how do you expose those?

Helm

If you use helm, the easiest way is to just add one more flag into the command:

helm upgrade --install ingress-nginx ingress-nginx   --repo https://kubernetes.github.io/ingress-nginx   --namespace ingress-nginx --create-namespace  \
--set controller.replicaCount=2 \
--set tcp.3306="default/minimal-cluster-haproxy:3306"  \
--set tcp.3307="default/minimal-cluster2-haproxy:3306" \
--set tcp.3308="default/minimal-cluster3-haproxy:3306" \
--set tcp.3309="default/minimal-cluster4-haproxy:3306"

No helm

Without Helm, it is a two-step process:

First, edit the

configMap

which configures TCP services exposure. By default it is called

ingress-nginx-tcp

:

kubectl -n ingress-nginx edit cm ingress-nginx-tcp
…
apiVersion: v1
data:
  "3306": default/minimal-cluster-haproxy:3306
  "3307": default/minimal-cluster2-haproxy:3306
  "3308": default/minimal-cluster3-haproxy:3306
  "3309": default/minimal-cluster4-haproxy:3306

Change in

configMap

will trigger the reconfiguration of nginx in ingress pods. But as a second step, it is also necessary to expose this port on a load balancer. To do so – edit the corresponding service:

kubectl -n ingress-nginx edit services ingress-nginx-controller
…
spec:
  ports:
    …
  - name: 3309-tcp
    port: 3309
    protocol: TCP
    targetPort: 3309-tcp

The new cluster is exposed on port 3309 now.

Limitations and considerations

Ports per Load Balancer

Cloud providers usually limit the number of ports that you can expose through a single load balancer:

  • AWS has 50 listeners per NLB, GCP 100 ports per service.

If you hit the limit, just create another load balancer pointing to the ingress controller.

Automation

Cost-saving is a good thing, but with Kubernetes capabilities, users expect to avoid manual tasks, not add more. Integrating the change of ingress configMap and load balancer ports into CICD is not a hard task, but maintaining the logic of adding new load balancers to add more ports is harder. I have not found any projects that implement the logic of reusing load balancer ports or automating it in any way. If you know of any – please leave a comment under this blog post.

Mar
15
2022
--

Run PostgreSQL on Kubernetes with Percona Operator & Pulumi

Run PostgreSQL on Kubernetes with Percona Operator and Pulumi

Avoid vendor lock-in, provide a private Database-as-a-Service for internal teams, quickly deploy-test-destroy databases with CI/CD pipeline – these are some of the most common use cases for running databases on Kubernetes with operators. Percona Distribution for PostgreSQL Operator enables users to do exactly that and more.

Pulumi is an infrastructure-as-a-code tool, which enables developers to write code in their favorite language (Python, Golang, JavaScript, etc.) to deploy infrastructure and applications easily to public clouds and platforms such as Kubernetes.

This blog post is a step-by-step guide on how to deploy a highly-available PostgreSQL cluster on Kubernetes with our Percona Operator and Pulumi.

Desired State

We are going to provision the following resources with Pulumi:

  • Google Kubernetes Engine cluster with three nodes. It can be any Kubernetes flavor.
  • Percona Operator for PostgreSQL
  • Highly available PostgreSQL cluster with one primary and two hot standby nodes
  • Highly available pgBouncer deployment with the Load Balancer in front of it
  • pgBackRest for local backups

Pulumi code can be found in this git repository.

Prepare

I will use the Ubuntu box to run Pulumi, but almost the same steps would work on macOS.

Pre-install Packages

gcloud and kubectl

echo "deb [signed-by=/usr/share/keyrings/cloud.google.gpg] https://packages.cloud.google.com/apt cloud-sdk main" | sudo tee -a /etc/apt/sources.list.d/google-cloud-sdk.list
curl https://packages.cloud.google.com/apt/doc/apt-key.gpg | sudo apt-key --keyring /usr/share/keyrings/cloud.google.gpg add -
sudo apt-get update
sudo apt-get install -y google-cloud-sdk docker.io kubectl jq unzip

python3

Pulumi allows developers to use the language of their choice to describe infrastructure and applications. I’m going to use python. We will also pip (python package-management system) and venv (virtual environment module).

sudo apt-get install python3 python3-pip python3-venv

Pulumi

Install Pulumi:

curl -sSL https://get.pulumi.com | sh

On macOS, this can be installed view Homebrew with

brew install pulumi


You will need to add .pulumi/bin to the $PATH:

export PATH=/usr/local/sbin:/usr/local/bin:/usr/sbin:/usr/bin:/sbin:/bin:/usr/games:/usr/local/games:/snap/bin:/home/percona/.pulumi/bin

Authentication

gcloud

You will need to provide access to Google Cloud to provision Google Kubernetes Engine.

gcloud config set project your-project
gcloud auth application-default login
gcloud auth login

Pulumi

Generate Pulumi token at app.pulumi.com. You will need it later to init Pulumi stack:

Action

This repo has the following files:

  • Pulumi.yaml

    – identifies that it is a folder with Pulumi project

  • __main__.py

    – python code used by Pulumi to provision everything we need

  • requirements.txt

    – to install required python packages

Clone the repo and go to the

pg-k8s-pulumi

folder:

git clone https://github.com/spron-in/blog-data
cd blog-data/pg-k8s-pulumi

Init the stack with:

pulumi stack init pg

You will need the key here generated before on app.pulumi.com.

__main__.py

Python code that Pulumi is going to process is in __main__.py file. 

Lines 1-6: importing python packages

Lines 8-31: configuration parameters for this Pulumi stack. It consists of two parts:

  • Kubernetes cluster configuration. For example, the number of nodes.
  • Operator and PostgreSQL cluster configuration – namespace to be deployed to, service type to expose pgBouncer, etc.

Lines 33-80: deploy GKE cluster and export its configuration

Lines 82-88: create the namespace for Operator and PostgreSQL cluster

Lines 91-426: deploy the Operator. In reality, it just mirrors the operator.yaml from our Operator.

Lines 429-444: create the secret object that allows you to set the password for pguser to connect to the database

Lines 445-557: deploy PostgreSQL cluster. It is a JSON version of cr.yaml from our Operator repository

Line 560: exports Kubernetes configuration so that it can be reused later 

Deploy

At first, we will set the configuration for this stack. Execute the following commands:

pulumi config set gcp:project YOUR_PROJECT
pulumi config set gcp:zone us-central1-a
pulumi config set node_count 3
pulumi config set master_version 1.21

pulumi config set namespace percona-pg
pulumi config set pg_cluster_name pulumi-pg
pulumi config set service_type LoadBalancer
pulumi config set pg_user_password mySuperPass

These commands set the following:

  • GCP project where GKE is going to be deployed
  • GCP zone 
  • Number of nodes in a GKE cluster
  • Kubernetes version
  • Namespace to run PostgreSQL cluster
  • The name of the cluster
  • Expose pgBouncer with LoadBalancer object

Deploy with the following command:

$ pulumi up
Previewing update (pg)

View Live: https://app.pulumi.com/spron-in/percona-pg-k8s/pg/previews/d335d117-b2ce-463b-867d-ad34cf456cb3

     Type                                                           Name                                Plan       Info
 +   pulumi:pulumi:Stack                                            percona-pg-k8s-pg                   create     1 message
 +   ?? random:index:RandomPassword                                 pguser_password                     create
 +   ?? random:index:RandomPassword                                 password                            create
 +   ?? gcp:container:Cluster                                       gke-cluster                         create
 +   ?? pulumi:providers:kubernetes                                 gke_k8s                             create
 +   ?? kubernetes:core/v1:ServiceAccount                           pgoPgo_deployer_saServiceAccount    create
 +   ?? kubernetes:core/v1:Namespace                                pgNamespace                         create
 +   ?? kubernetes:batch/v1:Job                                     pgoPgo_deployJob                    create
 +   ?? kubernetes:core/v1:ConfigMap                                pgoPgo_deployer_cmConfigMap         create
 +   ?? kubernetes:core/v1:Secret                                   percona_pguser_secretSecret         create
 +   ?? kubernetes:rbac.authorization.k8s.io/v1:ClusterRoleBinding  pgo_deployer_crbClusterRoleBinding  create
 +   ?? kubernetes:rbac.authorization.k8s.io/v1:ClusterRole         pgo_deployer_crClusterRole          create
 +   ?? kubernetes:pg.percona.com/v1:PerconaPGCluster               my_cluster_name                     create

Diagnostics:
  pulumi:pulumi:Stack (percona-pg-k8s-pg):
    E0225 14:19:49.739366105   53802 fork_posix.cc:70]           Fork support is only compatible with the epoll1 and poll polling strategies

Do you want to perform this update? yes

Updating (pg)
View Live: https://app.pulumi.com/spron-in/percona-pg-k8s/pg/updates/5
     Type                                                           Name                                Status      Info
 +   pulumi:pulumi:Stack                                            percona-pg-k8s-pg                   created     1 message
 +   ?? random:index:RandomPassword                                 pguser_password                     created
 +   ?? random:index:RandomPassword                                 password                            created
 +   ?? gcp:container:Cluster                                       gke-cluster                         created
 +   ?? pulumi:providers:kubernetes                                 gke_k8s                             created
 +   ?? kubernetes:core/v1:ServiceAccount                           pgoPgo_deployer_saServiceAccount    created
 +   ?? kubernetes:core/v1:Namespace                                pgNamespace                         created
 +   ?? kubernetes:core/v1:ConfigMap                                pgoPgo_deployer_cmConfigMap         created
 +   ?? kubernetes:batch/v1:Job                                     pgoPgo_deployJob                    created
 +   ?? kubernetes:core/v1:Secret                                   percona_pguser_secretSecret         created
 +   ?? kubernetes:rbac.authorization.k8s.io/v1:ClusterRole         pgo_deployer_crClusterRole          created
 +   ?? kubernetes:rbac.authorization.k8s.io/v1:ClusterRoleBinding  pgo_deployer_crbClusterRoleBinding  created
 +   ?? kubernetes:pg.percona.com/v1:PerconaPGCluster               my_cluster_name                     created

Diagnostics:
  pulumi:pulumi:Stack (percona-pg-k8s-pg):
    E0225 14:20:00.211695433   53839 fork_posix.cc:70]           Fork support is only compatible with the epoll1 and poll polling strategies

Outputs:
    kubeconfig: "[secret]"

Resources:
    + 13 created

Duration: 5m30s

Verify

Get kubeconfig first:

pulumi stack output kubeconfig --show-secrets > ~/.kube/config

Check if Pods of your PG cluster are up and running:

$ kubectl -n percona-pg get pods
NAME                                             READY   STATUS      RESTARTS   AGE
backrest-backup-pulumi-pg-dbgsp                  0/1     Completed   0          64s
pgo-deploy-8h86n                                 0/1     Completed   0          4m9s
postgres-operator-5966f884d4-zknbx               4/4     Running     1          3m27s
pulumi-pg-787fdbd8d9-d4nvv                       1/1     Running     0          2m12s
pulumi-pg-backrest-shared-repo-f58bc7657-2swvn   1/1     Running     0          2m38s
pulumi-pg-pgbouncer-6b6dc4564b-bh56z             1/1     Running     0          81s
pulumi-pg-pgbouncer-6b6dc4564b-vpppx             1/1     Running     0          81s
pulumi-pg-pgbouncer-6b6dc4564b-zkdwj             1/1     Running     0          81s
pulumi-pg-repl1-58d578cf49-czm54                 0/1     Running     0          46s
pulumi-pg-repl2-7888fbfd47-h98f4                 0/1     Running     0          46s
pulumi-pg-repl3-cdd958bd9-tf87k                  1/1     Running     0          46s

Get the IP-address of pgBouncer LoadBalancer:

$ kubectl -n percona-pg get services
NAME                             TYPE           CLUSTER-IP     EXTERNAL-IP    PORT(S)                      AGE
…
pulumi-pg-pgbouncer              LoadBalancer   10.20.33.122   35.188.81.20   5432:32042/TCP               3m17s

You can connect to your PostgreSQL cluster through this IP-address. Use pguser password that was set earlier with

pulumi config set pg_user_password

:

psql -h 35.188.81.20 -p 5432 -U pguser pgdb

Clean up

To delete everything it is enough to run the following commands:

pulumi destroy
pulumi stack rm

Tricks and Quirks

Pulumi Converter

kube2pulumi is a huge help if you already have YAML manifests. You don’t need to rewrite the whole code, but just convert YAMLs to Pulumi code. This is what I did for operator.yaml.

apiextensions.CustomResource

There are two ways for Custom Resource management in Pulumi:

crd2pulumi generates libraries/classes out of Custom Resource Definitions and allows you to create custom resources later using these. I found it a bit complicated and it also lacks documentation.

apiextensions.CustomResource on the other hand allows you to create Custom Resources by specifying them as JSON. It is much easier and requires less manipulation. See lines 446-557 in my __main__.py.

True/False in JSON

I have the following in my Custom Resource definition in Pulumi code:

perconapg = kubernetes.apiextensions.CustomResource(
…
    spec= {
…
    "disableAutofail": False,
    "tlsOnly": False,
    "standby": False,
    "pause": False,
    "keepData": True,

Be sure that you use boolean of the language of your choice and not the “true”/”false” strings. For me using the strings turned into a failure as the Operator was expecting boolean, not the strings.

Depends On…

Pulumi makes its own decisions on the ordering of provisioning resources. You can enforce the order by specifying dependencies

For example, I’m ensuring that Operator and Secret are created before the Custom Resource:

    },opts=ResourceOptions(provider=k8s_provider,depends_on=[pgo_pgo_deploy_job,percona_pg_cluster1_pguser_secret_secret])

Mar
07
2022
--

Manage Your Data with Mingo.io and Percona Distribution for MongoDB Operator

Mingo.io and Percona Distribution for MongoDB Operator

Mingo.io and Percona Distribution for MongoDB OperatorDeploying MongoDB on Kubernetes has never been simpler with Percona Distribution for MongoDB Operator. It provides you with an enterprise-ready MongoDB cluster with no manual burden. In addition to that, you also get automated day-to-day operations – scaling, backups, upgrades.

But once you have your cluster up and running and have a good grasp on managing it, you still need to manage the data itself – collections, indexes, shards. We at Percona focus on infrastructure, data consistency, and the health of the cluster, but data is an integral part of any database that should be managed. In this blog post, we will see how the user can manage, browse and query the data of a MongoDB cluster with mingo.io. Mingo.io is a tool that I have discovered recently and it reminded me of PHPMyAdmin, but with a great user interface, feature set, and that it is for MongoDB, not MySQL.

This post provides a step-by-step guide on how to deploy MongoDB locally, connect it with Mingo.io, and manage the data. We want to have a local setup so that anyone would be able to try it at home.

Deploy the Operator and the Database

For local installation, I will use microk8s and minimal cr.yaml for MongoDB, which deploys a one-node replica set with sharding. It is enough for the demo.

Start Kubernetes Cluster

As I use Ubuntu, I will install microk8s from snap:

# snap install microk8s --classic

We need to start microk8s and enable Domain Name Service (DNS) and storage support:

# microk8s start
# microk8s enable dns storage

Kubernetes cluster is ready, let’s fetch kubeconfig from it to use regular kubectl:

# microk8s config > /home/percona/.kube/config

MongoDB Up and Running

Install the Operator:

kubectl apply -f https://raw.githubusercontent.com/spron-in/blog-data/master/mingo/bundle.yaml

Deploy MongoDB itself:

kubectl apply -f https://raw.githubusercontent.com/spron-in/blog-data/master/mingo/cr-minimal.yaml

Connect to MongoDB

To connect to MongoDB we need a connection string with the login and password. In this example, we expose mongos with a NodePort service type. Find the Port to connect to:

$ kubectl get services
NAME                     TYPE        CLUSTER-IP      EXTERNAL-IP   PORT(S)           AGE
…
minimal-cluster-mongos   NodePort    10.152.183.46   <none>        27017:32609/TCP   32m

You can connect to the MongoDB cluster using the IP address of your machine and port 32609. 

To demonstrate the full power of Mingo, we will need to create a user first to manage the data:

Get userAdmin password

$ kubectl get secrets minimal-cluster -o yaml | awk '$1~/MONGODB_USER_ADMIN_PASSWORD/ {print $2}' | base64 --decode
4OnZ2RZ3SpRVtKbUxy

Run MongoDB client Pod

kubectl run -i --rm --tty percona-client --image=percona/percona-server-mongodb:4.4.10-11 --restart=Never -- bash -il

Connect to Mongo

mongo "mongodb://userAdmin:4OnZ2RZ3SpRVtKbUxy@minimal-cluster-mongos.default.svc.cluster.local/admin?ssl=false"

Create the user in mongo shell:

db.createUser( { user: "test", pwd: "mysUperpass", roles: [ "userAdminAnyDatabase", "readWriteAnyDatabase", "dbAdminAnyDatabase" ] } )

The connection strict that I would use in Mingo would look like this:

mongodb://test:mySuperpass@10.10.3.4:32609

IP address and port most likely would be different for you.

Mingo at Work

MongoDB cluster is up and running. Let’s have Mingo installed and configured.

First, download the latest version of Mingo from https://mingo.io/ On the first opening after installation you will be welcomed with the message about Mingo’s security.

Once you are prompted for your first MongoDB connection, paste your mongo URL into the field and submit. Now you are connected and ready to manage your data.

Mingo.io

Now, let’s try two examples of how Mingo works.

Example 1

Let’s assume you have a collection called “Blog” and you want to rename it to “Articles”. First, locate the collection in the sidebar, right-click it and select “Rename collection…” in the context menu. Type the new collection name and hit Enter. That’s it.


Example 2

Let’s assume you have a collection called “orders” with the field “shippedDate”, and you want to rename this field to shipmentDate in every document that was created during 2020. How would you do this in the old way? Would it be easy? Let’s see how you can do this in Mingo.

Instead of complicated queries with dates, we can use a simple shorthand { “OrderDate”: #2020 } and press Submit to see the results. Now just expand any document and then right-click on shippedDate. From the context menu select “Rename Fields ? Filtered documents…” and then just insert the correct name and hit Rename.

Example 3

Let’s customize the way we see the “Orders” collection, for example.

First, click CMD+T (or CTRL+T on Windows), start typing the name of the collection in the Finder until you see it. Then, using the up and down arrow keys, select the collection and press Enter. Alternatively, you can click on the collection in the sidebar.

When the collection is shown, Mingo picks a couple of columns to show. To add another column, click on the + icon and select the field to add. You can rearrange the columns by dragging their headers. Click on the column header to see all the actions for a column and explore them.

Projects

On top of regular MongoDB connections, Mingo offers “Projects”. A project is like a wrapper on several connections to different databases, such as development, production, testing. Mingo treats these databases as siblings and simplifies routine tasks, such as synchronization, backups, shared settings for sibling collections and many more.

Have a Quick Glance at Mingo in Action


Conclusion

Deploying and managing MongoDB clusters on Kubernetes is still in its early phase. Percona is committed to delivering enterprise-grade solutions to deploy and manage databases on Kubernetes.

We are focused on infrastructure and data consistency, whereas Mingo.io empowers users to perform data management on any MongoDB cluster.

Percona Distribution for MongoDB Operator contains everything you need to quickly and consistently deploy and scale Percona Server for MongoDB instances into a Kubernetes cluster on-premises or in the cloud. The Operator enables you to improve time to market with the ability to quickly deploy standardized and repeatable database environments. Deploy your database with a consistent and idempotent result no matter where they are used.

Mingo

As NodeJS developers, heavily using MongoDB for our projects, we have long dreamed of a better MongoDB admin tool.

Existing solutions lacked usability and features to make browsing and querying documents enjoyable. They would easily analyze data, list documents, and build aggregations, but they felt awkward with simple everyday tasks, such as finding a document quickly, viewing its content in a nice layout, or doing common actions with one click. Since dreaming only gets you so far, we started working on a new MongoDB admin.

Our goal at Mingo is to create a MongoDB GUI with superb user experience, modern design, and productive features to speed up your work and make you fall in love with your data.

Powered by WordPress | Theme: Aeros 2.0 by TheBuckmaker.com