Mar
09
2018
--

This Week in Data with Colin Charles 31: Meltdown/Spectre Performance Regressions and Percona Live 2018

Colin Charles

Join Percona Chief Evangelist Colin Charles as he covers happenings, gives pointers and provides musings on the open source database community.

Have you been following the Meltdown/Spectre performance regressions? Some of the best blog posts have been coming from Brendan Gregg, who’s keynoting at Percona Live this year. We’ve also got Scott Simpson from Upwork giving a keynote about how and why they use MongoDB. This is in addition to all the other fun talks we have, so please register now. Don’t forget to also book your hotel room!

Even though the Percona Live conference now covers much more than just MySQL, it’s worth noting that the MySQL Community Awards 2018: Call for Nominations! is happening now. You have until Friday, March 15, 2018, to make a nomination. Winners get into the Hall of Fame. Yes, I am also on the committee to make selections.

Another highlight: Open-sourcing a 10x reduction in Apache Cassandra tail latency by Dikang Gu of Instagram (Facebook). This is again thanks to RocksDB. Check out Rocksandra, and don’t forget to register for Percona Live to see the talk: Cassandra on RocksDB.

This week, I spent some time at Percona Headquarters in Raleigh, North Carolina. The building from the outside is pictured well in Google Maps. I thought it might be fun to show you a few photos (the office is huge with quite a handful working there despite the fact that Percona is largely remote).

Peter at Percona Headquarters
Percona awards and bookshelf, featuring some very antique encyclopedias.


Peter at Percona Headquarters 2
Peter Zaitsev, Percona CEO, outside his office (no, it is not an open office plan – everyone has rooms, including visitors like myself).


We’re all at SCALE16x now – so come see our talks (Peter Zaitsev and I are both speaking), and we have a booth where you can say hello to Rick Golba, Marc Sherwood and Dave Avery.

Releases

Link List

Upcoming appearances

  • SCALE16x – Pasadena, California, USA – March 8-11 2018
  • FOSSASIA 2018 – Singapore – March 22-25 2018

Feedback

I look forward to feedback/tips via e-mail at colin.charles@percona.com or on Twitter @bytebot.

Mar
08
2018
--

Binlog Encryption with Percona Server for MySQL

binlog encryption

In this blog post, we’ll look at how to turn on binlog encryption in Percona Server for MySQL.

Why do I need this?

As you probably know, Percona Server for MySQL’s binlog contains sensitive information. Replication uses the binlog to copy events between servers. They contain all the information from one server so that it can be applied on another. In other words, if somebody has access to a binlog, it means they have access to all the data in the server. Moreover, said person (or, “Hacker”) could create a clone copy of our server by just making a replica of it. In the end, they have access to our binlog. This shows how important protecting a binlog really is – leakage of binlogs not only make a particular table/tablespace or a group of tables accessible to a hacker, but literally the whole server is at risk. The same situation is true with relay log – a relay log is really a copy of binlog on the slave server.

But have no fear – a new feature to the rescue – binary log encryption. Since Percona Server for MySQL version 5.7.20-19 (beta version) it is possible to enable binlog encryption for all the binlogs and relay logs produced by the server.

How do you turn it on?

To start binlog encryption, you need to start the server with –encrypt-binlog=1. This, in turn, requires –master_verify_checksum and –binlog_checksum both to be ON. Also, you need to install one of the keyring plugins.

From now on all the binlogs and relay logs produced by the server get encrypted. However, for the replication to be safe as a whole the connection between servers also has to be encrypted. See https://dev.mysql.com/doc/refman/5.7/en/replication-solutions-encrypted-connections.html for details on how to do this.

Please note that this does not mean that all binlogs in our replication schema get encrypted. Remember you need to turn on encrypt-binlog on slave servers too, even if they do not produce binlog files. Slave servers still produce relay logs when replicating from a master server. Turn on encrypt-binlog on slave servers so that their relay logs also get encrypted.

How does this work in the big picture?

The master encrypts the event before writing it into the binlog. The slave connects to master and ask for events. The master decrypts the events from the binary log and sends them over to slave.

Note that events send between the master and slave servers are not encrypted! This is why the connection between the master and slave needs to use a secure channel, i.e., TLS.

The slave receives events from the master, encrypts them and writes them down into the relay log.

That is why we need to enable encrypt-binlog on a slave. The relay log has to get encrypted too.

Next, the slave decrypts events from relay log and applies them. After applying the event the slave encrypts it and writes it down into its binlog file (given binlog is enabled on the slave).

In summary to make our replication secure, we need:

  • Turn on encrypt-binlog on the master
  • Turn on encrypt-binlog on the slave
  • The connection between master and slave needs to use TLS.

It’s worth noting that servers in replication have no idea if other servers are encrypted or not.

Why do master_verify_checksum and binlog_checksum need to be turned ON?

This is needed for “authenticate encryption”. Simply put, this is how we make sure that what we decrypt has not been changed by a third party. Also, it checks if the key that was used to decrypt the event was the correct one.

Digging deeper with mysqlbinlog

Mysqlbinlog is a standalone application that lets you read binlog files. As I write this blog post, it is not capable of decrypting binary logs – at least not by itself. However, it still can read encrypted binlog files when using a running Percona Server for MySQL. Use option –read-from-remote-server to read binary log produced by a given server.

Let’s see what happens when we try to read an encrypted binlog with mysqlbinlog without read-from-remote-server enabled. You will get something like this:

As you can see it is only possible to read binary log till event type 9f gets read. This event is the Start_encryption_event. After this event the rest of the binlog is encrypted. One thing to note is that Start_encryption_event is never propagated in replication. For instance, the master server is run with –encryt_binlog. This means that the server writes Start_encryption_event to its binary logs. However it is never sent to the slave server (the slave has no idea whether the master is encrypted).

Another option you can use with mysqlbinlog is –force option. It forces mysqlbinlog to read all the events from the binlog, even if they are encrypted. You will see something like this in the output:

As you can see, it is only possible to read two first events – until the Start_encryption_event. However, this time we can see that there are other events that follow, which are encrypted.

Running mysqlbinlog (without –read-from-remote) on encrypted binary logs may only make sense if we want to see if a given binary log is encrypted. For point-in-time recovery, and for other purposes that might require reading encrypted binlog, we would use mysqlbinlog with –read-from-remote option.

For instance, if we want to read binlog master-bin.000001, and Percona Server for MySQL is running on 127.0.0.1, port 3033, with user:robert, password:hard_password, we would use mysqlbinlog like this:

mysqlbinlog –read-from-remote-server –protocol=tcp –host=127.0.0.1 –port=3033 –user=robert –password=hard_password master-bing.000001.

When you look at the output of this command, you see something like this:

You can now see the decrypted binlog. One interesting thing to note here is that we do not see our Start_encryption_event (type 9f). This proves my point – Start_encryption_event never leaves the server (we are reading from the server now as we use –read-from-remote-server).

For more information how to use mysqlbinlog for point-in-time recovery see https://dev.mysql.com/doc/refman/5.7/en/point-in-time-recovery.html.

However, for more modern approaches for point-in-time recovery that do not use mysqlbinlog and make use of parallel appliers, see here:

Have fun with binlog encryption!

Feb
23
2018
--

Webinar Tuesday February 27, 2018: Monitoring Amazon RDS with Percona Monitoring and Management (PMM)

Monitoring Amazon RDS

Monitoring Amazon RDSPlease join Percona’s Build / Release Engineer, Mykola Marzhan, as he presents Monitoring Amazon RDS with Percona Monitoring and Management on February 27, 2018, at 7:00 am PDT (UTC-8) / 10:00 am EDT (UTC-5).


Are you concerned about how you are monitoring your AWS environment? Keeping track of what is happening in your Amazon RDS deployment is key to guaranteeing the performance and availability of your database for your critical applications and services.

Did you know that Percona Monitoring and Management (PMM) ships with support for MySQL on Amazon RDS and Amazon Aurora out of the box? It does!

Percona Monitoring and Management (PMM) is a free and open-source platform for managing and monitoring MySQL, Percona Server for MySQL MariaDB, MongoDB, Percona Server for MongoDB performance both on-premise and in the cloud.

In this session we’ll discuss:

  • Configuring PMM (metrics and queries) against Amazon RDS MySQL and Amazon Aurora using an EC2 instance
  • Configuring PMM against CloudWatch metrics
  • Setting configuration parameters for AWS for maximum PMM visibility

Register for the webinar now.

mykolaMykola Marzhan, Release Engineer

Mykola joined Percona in 2016 as a release engineer. He has been developing monitoring systems since 2004, and has been working as Release Engineer/Release Manager/DevOps for ten years. Recently, Mykola achieved an AWS Certified Solutions Architect (Professional) authentication.


Feb
22
2018
--

How to Restore MySQL Logical Backup at Maximum Speed

Restore MySQL Logical Backup

Restore MySQL Logical BackupThe ability to restore MySQL logical backups is a significant part of disaster recovery procedures. It’s a last line of defense.

Even if you lost all data from a production server, physical backups (data files snapshot created with an offline copy or with Percona XtraBackup) could show the same internal database structure corruption as in production data. Backups in a simple plain text format allow you to avoid such corruptions and migrate between database formats (e.g., during a software upgrade and downgrade), or even help with migration from completely different database solution.

Unfortunately, the restore speed for logical backups is usually bad, and for a big database it could require days or even weeks to get data back. Thus it’s important to tune backups and MySQL for the fastest data restore and change settings back before production operations.

Disclaimer

All results are specific to my combination of hardware and dataset, but could be used as an illustration for MySQL database tuning procedures related to logical backup restore.

Benchmark

There is no general advice for tuning a MySQL database for a bulk logical backup load, and any parameter should be verified with a test on your hardware and database. In this article, we will explore some variables that help that process. To illustrate the tuning procedure, I’ve downloaded IMDB CSV files and created a MySQL database with pyimdb.

You may repeat the whole benchmark procedure, or just look at settings changed and resulting times.

Database:

  • 16GB – InnoDB database size
  • 6.6GB – uncompressed mysqldump sql
  • 5.8GB – uncompressed CSV + create table statements.

The simplest restore procedure for logical backups created by the mysqldump tool:

mysql -e 'create database imdb;'
time mysql imdb < imdb.sql
# real 129m51.389s

This requires slightly more than two hours to restore the backup into the MySQL instance started with default settings.

I’m using the Docker image percona:latest – it contains Percona Server 5.7.20-19 running on a laptop with 16GB RAM, Intel(R) Core(TM) i7-7700HQ CPU @ 2.80GHz, two disks: SSD KINGSTON RBU-SNS and HDD HGST HTS721010A9.

Let’s start with some “good” settings: buffer pool bigger than default, 2x1GB transaction log files, disable sync (because we are using slow HDD), and set big values for IO capacity,
the load should be faster with big batches thus use 1GB for max_allowed_packet.

Values were chosen to be bigger than the default MySQL parameters because I’m trying to see the difference between the usually suggested values (like 80% of RAM should belong to InnoDB buffer pool).

docker run --publish-all --name p57 -it -e MYSQL_ALLOW_EMPTY_PASSWORD=1 percona:5.7
  --innodb_buffer_pool_size=4GB
  --innodb_log_file_size=1G
  --skip-log-bin
  --innodb_flush_log_at_trx_commit=0
  --innodb_flush_method=nosync
  --innodb_io_capacity=2000
  --innodb_io_capacity_max=3000
  --max_allowed_packet=1G
  time (mysql --max_allowed_packet=1G imdb1 < imdb.sql )
  # real 59m34.252s

The load is IO bounded, and there is no reaction on set global foreign_key_checks=0 and unique_checks=0 because these variables are already disabled in the dump file.

How can we reduce IO?

Disable InnoDB double write: --innodb_doublewrite=0

time (mysql --max_allowed_packet=1G imdb1 < imdb.sql )
# real 44m49.963s

A huge improvement, but we still have an IO-bounded load.

We will not be able to improve load time significantly for IO bounded load. Let’s move to SSD:

time (mysql --max_allowed_packet=1G imdb1 < imdb.sql )
# real 33m36.975s

Is it vital to disable disk sync for the InnoDB transaction log?

sudo rm -rf mysql/*
docker rm p57
docker run -v /home/ihanick/Private/Src/tmp/data-movies/imdb.sql:/root/imdb.sql -v /home/ihanick/Private/Src/tmp/data-movies/mysql:/var/lib/mysql
--name p57 -it -e MYSQL_ALLOW_EMPTY_PASSWORD=1 percona:5.7
--innodb_buffer_pool_size=4GB
--innodb_log_file_size=1G
--skip-log-bin
--innodb_flush_log_at_trx_commit=0
--innodb_io_capacity=700
--innodb_io_capacity_max=1500
--max_allowed_packet=1G
--innodb_doublewrite=0
# real 33m49.724s

There is no significant difference.

By default, mysqldump produces SQL data, but it could also save data to CSV format:

cd /var/lib/mysql-files
mkdir imdb
chown mysql:mysql imdb/
time mysqldump --max_allowed_packet=128M --tab /var/lib/mysql-files/imdb imdb1
# real 1m45.983s
sudo rm -rf mysql/*
docker rm p57
docker run -v /srv/ihanick/tmp/imdb:/var/lib/mysql-files/imdb -v /home/ihanick/Private/Src/tmp/data-movies/mysql:/var/lib/mysql
--name p57 -it -e MYSQL_ALLOW_EMPTY_PASSWORD=1 percona:5.7
--innodb_buffer_pool_size=4GB
--innodb_log_file_size=1G
--skip-log-bin
--innodb_flush_log_at_trx_commit=0
--innodb_io_capacity=700
--innodb_io_capacity_max=1500
--max_allowed_packet=1G
--innodb_doublewrite=0
time (
mysql -e 'drop database imdb1;create database imdb1;set global FOREIGN_KEY_CHECKS=0;'
(echo "SET FOREIGN_KEY_CHECKS=0;";cat *.sql) | mysql imdb1 ;
for i in $PWD/*.txt ; do mysqlimport imdb1 $i ; done
)
# real 21m56.049s
1.5X faster, just because of changing the format from SQL to CSV!

We’re still using only one CPU core, let’s improve the load with the –use-threads=4 option:

time (
mysql -e 'drop database if exists imdb1;create database imdb1;set global FOREIGN_KEY_CHECKS=0;'
(echo "SET FOREIGN_KEY_CHECKS=0;";cat *.sql) | mysql imdb1
mysqlimport --use-threads=4 imdb1 $PWD/*.txt
)
# real 15m38.147s

In the end, the load is still not fully parallel due to a big table: all other tables are loaded, but one thread is still active.

Let’s split CSV files into smaller ones. For example, 100k rows in each file and load with GNU/parallel:

# /var/lib/mysql-files/imdb/test-restore.sh
apt-get update ; apt-get install -y parallel
cd /var/lib/mysql-files/imdb
time (
cd split1
for i in ../*.txt ; do echo $i ; split -a 6 -l 100000 -- $i `basename $i .txt`. ; done
for i in `ls *.*|sed 's/^[^.]+.//'|sort -u` ; do
mkdir ../split-$i
for j in *.$i ; do mv $j ../split-$i/${j/$i/txt} ; done
done
)
# real 2m26.566s
time (
mysql -e 'drop database if exists imdb1;create database imdb1;set global FOREIGN_KEY_CHECKS=0;'
(echo "SET FOREIGN_KEY_CHECKS=0;";cat *.sql) | mysql imdb1
parallel 'mysqlimport imdb1 /var/lib/mysql-files/imdb/{}/*.txt' ::: split-*
)
#real 16m50.314s

Split is not free, but you can split your dump files right after backup.

The load is parallel now, but the single big table strikes back with ‘setting auto-inc lock’ in SHOW ENGINE INNODB STATUSG

Using the --innodb_autoinc_lock_mode=2 option fixes this issue: 16m2.567s.

We got slightly better results with just mysqlimport --use-threads=4. Let’s check if hyperthreading helps and if the problem caused by “parallel” tool:

  • Using four parallel jobs for load: 17m3.662s
  • Using four parallel jobs for load and two threads: 16m4.218s

There is no difference between GNU/Parallel and --use-threads option of mysqlimport.

Why 100k rows? With 500k rows: 15m33.258s

Now we have performance better than for mysqlimport --use-threads=4.

How about 1M rows at once? Just 16m52.357s.

I see periodic flushing logs message with bigger transaction logs (2x4GB): 12m18.160s:

--innodb_buffer_pool_size=4GB --innodb_log_file_size=4G --skip-log-bin --innodb_flush_log_at_trx_commit=0 --innodb_io_capacity=700 --innodb_io_capacity_max=1500 --max_allowed_packet=1G --innodb_doublewrite=0 --innodb_autoinc_lock_mode=2 --performance-schema=0

Let’s compare the number with myloader 0.6.1 also running with four threads (myloader have only -d parameter, myloader execution time is under corresponding mydumper command):

# oversized statement size to get 0.5M rows in one statement, single statement per chunk file
mydumper -B imdb1 --no-locks --rows 500000 --statement-size 536870912 -o 500kRows512MBstatement
17m59.866s
mydumper -B imdb1 --no-locks -o default_options
17m15.175s
mydumper -B imdb1 --no-locks --chunk-filesize 128 -o chunk128MB
16m36.878s
mydumper -B imdb1 --no-locks --chunk-filesize 64 -o chunk64MB
18m15.266s

It will be great to test mydumper with CSV format, but unfortunately, it wasn’t implemented in the last 1.5 years: https://bugs.launchpad.net/mydumper/+bug/1640550.

Returning back to parallel CSV files load, even bigger transaction logs 2x8GB: 11m15.132s.

What about a bigger buffer pool: --innodb_buffer_pool_size=12G? 9m41.519s

Let’s check six-year-old server-grade hardware: Intel(R) Xeon(R) CPU E5-2430 with SAS raid (used only for single SQL file restore test) and NVMe (Intel Corporation PCIe Data Center SSD, used for all other tests).

I’m using similar options as for previous tests, with 100k rows split for CSV files load:

--innodb_buffer_pool_size=8GB --innodb_log_file_size=8G --skip-log-bin --innodb_flush_log_at_trx_commit=0 --innodb_io_capacity=700 --innodb_io_capacity_max=1500 --max_allowed_packet=1G --innodb_doublewrite=0 --innodb_autoinc_lock_mode=2

  • Single SQL file created by mysqldump loaded for 117m29.062s = 2x slower.
  • 24 parallel processes of mysqlimport: 11m51.718s
  • Again hyperthreading making a huge difference! 12 parallel jobs: 18m3.699s.
  • Due to higher concurrency, adaptive hash index is a reason for locking contention. After disabling it with --skip-innodb_adaptive_hash_index: 10m52.788s.
  • In many places, disable unique checks referred as a performance booster: 10m52.489s
    You can spend more time reading advice about unique_checks, but it might help for some databases with many unique indexes (in addition to primary one).
  • The buffer pool is smaller than the dataset, can you change old/new pages split to make insert faster? No: --innodb_old_blocks_pct=5 : 10m59.517s.
  • O_DIRECT is also recommended: --innodb_flush_method=O_DIRECT: 11m1.742s.
  • O_DIRECT is not able to improve performance by itself, but if you can use a bigger buffer pool: O_DIRECT + 30% bigger buffer pool: --innodb_buffeer_pool_size=11G: 10m46.716s.

Conclusions

  • There is no common solution to improve logical backup restore procedure.
  • If you have IO-bounded restore: disable InnoDB double write. It’s safe because even if the database crashes during restore, you can restart the operation.
  • Do not use SQL dumps for databases > 5-10GB. CSV files are much faster for mysqldump+mysql. Implement mysqldump --tabs+mysqlimport or use mydumper/myloader with appropriate chunk-filesize.
  • The number of rows per load data infile batch is important. Usually 100K-1M, use binary search (2-3 iterations) to find a good value for your dataset.
  • InnoDB log file size and buffer pool size are really important options for backup restore performance.
  • O_DIRECT reduces insert speed, but it’s good if you can increase the buffer pool size.
  • If you have enough RAM or SSD, the restore procedure is limited by CPU. Use a faster CPU (higher frequency, turboboost).
  • Hyperthreading also counts.
  • A powerful server could be slower than your laptop (12×2.4GHz vs. 4×2.8+turboboost).
  • Even with modern hardware, it’s hard to expect backup restore faster than 50MBps (for the final size of InnoDB database).
  • You can find a lot of different advice on how to improve backup load speed. Unfortunately, it’s not possible to implement improvements blindly, and you should know the limits of your system with general Unix performance tools like vmstat, iostat and various MySQL commands like SHOW ENGINE INNODB STATUS (all can be collected together with pt-stalk).
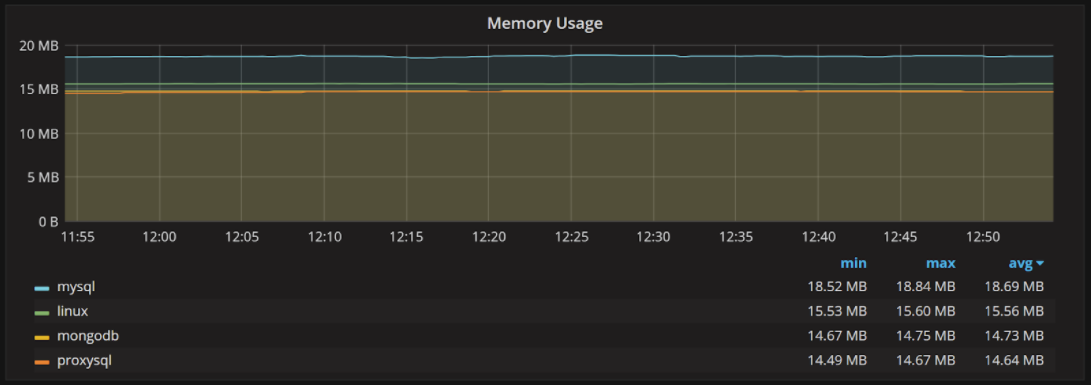
  • Percona Monitoring and Management (PMM) also provides good graphs, but you should be careful with QAN: full slow query log during logical database dump restore can cause significant processing load.
  • Default MySQL settings could cost you 10x backup restore slowdown
  • This benchmark is aimed at speeding up the restore procedure while the application is not running and the server is not used in production. Make sure that you have reverted all configuration parameters back to production values after load. For example, if you disable the InnoDB double write buffer during restore and left it enabled in production, you may have scary data corruption due to partial InnoDB pages writes.
  • If the application is running during restore, in most cases you will get an inconsistent database due to missing support for locking or correct transactions for restore methods (discussed above).
Feb
20
2018
--

Understand Your Prometheus Exporters with Percona Monitoring and Management (PMM)

Prometheus Exporters 2 small

In this blog post, I will look at the new dashboards in Percona Monitoring and Management (PMM) for Prometheus exporters.

Percona Monitoring and Management (PMM) uses Prometheus exporters to capture metrics data from the system it monitors. Those Prometheus exporters are an important part of your monitoring infrastructure, and understanding their performance and other operational details is critical for well-implemented monitoring.    

To help you with this we’ve added a number of new dashboards to Percona Monitoring and Management.

The Prometheus Exporters Overview dashboard provides a high-level overview of your installed Prometheus exporter infrastructure:

Prometheus Exporters

The summary shows you how many hosts are monitored and how many exporters you have running, as well as how much CPU and memory they are using.

Note that the CPU usage shown in this graph is only the CPU usage of the exporter itself. It does not include the additional resource usage that is required to produce metrics by the application or operating system.

Next, we have an overview of resource usage by the host:  

Prometheus Exporters 2

Prometheus Exporters 3

These graphs allow us to analyze the resource usage for different hosts, allowing us to clearly see if any of the hosts have unusually high CPU or memory usage by exporters.

You may notice some of the CPU usage reported on these graphs is very high. This is due to the fact that we use very high-resolution sampling and very underpowered instances for this demonstration environment. CPU usage numbers like this are not typical.

The next graphs show resource usage by the type of exporter:

Prometheus Exporters 4

Prometheus Exporters 5

In this case, we measure CPU usage in “CPU Cores” rather than as a percent – it is more meaningful. Otherwise, the same amount of actual resource usage by the exporter will look very different on a system with one core versus a system with 64 cores. Core usage numbers have a pretty stable baseline, though.

Then there is a list of your monitored hosts and the exporters they are running:

Prometheus Exporters 6

This shows your CPU usage and memory usage per host, as well as the number of exporters running and system details.

You can click on a host to get to the System Overview, or jump to Prometheus Exporter Status dashboard.

Prometheus Exporter Status dashboard allows you to investigate how specific exporters are performing for the given host. Each of the well-known exporters has its own row in this dashboard.

Node Exporter Status shows us the resource usage, uptime and performance of Node Exporter (the exporter responsible for capturing OS-level metrics):   

Prometheus Exporters 7

Prometheus Exporters 8

The “Collector Scrape Successful” shows which node_exporter collector category (which are modules that collect specific information) have returned data reliably. If you have anything but a flat line on “1” here, you need to check for problems.

“Collector Execution Time” shows how long on average it takes to execute your enabled collectors. This shows which collectors are generally more expensive to run (or if some of them are experiencing performance problems).

MySQL Exporter Status shows us how MySQL exporter is performing:

Prometheus Exporters 9

Additionally, in resource usage we see the rate of scrapes for High, Medium and Low resolution data.

Generally, you should see three flat lines here if everything is working well. This is not the case for this host, and we can see some scrapes are not successful – either failing to complete, or not triggered by Prometheus Server altogether (due to overload or connectivity issues).

Prometheus Exporters 10

These graphs provide information about MySQL Exporter Errors – permission errors and other issues. It also shows if MySQL Server was up during this time. There are also similar details reported for MongoDB and ProxySQL exporters if they are running on the host.

I hope these new dashboards help you to understand your Prometheus exporter performance better!

Feb
12
2018
--

Does Percona Monitoring and Management (PMM) Support External Monitoring Services? Yes It Does!

External Monitoring Services

Percona Monitoring and Management (PMM) is a free and open-source platform for managing and monitoring MySQL and MongoDB performance. You can run PMM in your own environment for maximum security and reliability. It provides thorough time-based analysis for MySQL and MongoDB servers to ensure that your data works as efficiently as possible.

Starting with version 1.4.0 and improved in 1.7.0, PMM supports external monitoring services. This means you can plug in Prometheus exporters for technologies not directly provided by Percona. For example, you can start monitoring the metrics of your PostgreSQL database host, Memcached or Redis.

Exporters Overview

Applications store their metrics in arbitrary formats, and Prometheus exporters collect them and produce (or export to) a consistent format of key-value pairs. The keys refer to metric types and values are numbers in the float 64 format. Due to the diversity of formats that applications may use, you should program a specific exporter for each format. However, if you decide to make the metrics of your application available via PMM you may consider using one of existing Prometheus exporters.

Currently, PMM offers exporters for MySQL (mysqld_exporter) and MongoDB (mongodb_exporter) database management systems. Built-in exporters also exist for Percona XtraDBCluster, MariaDB, RDS and Aurora via mysqld_exporter and for ProxySQL (via proxysql_exporter). These exporters are made available as monitoring services that you can add or remove as necessary. In addition, PMM includes the node_exporter to capture the host level Linux metrics such as CPU, Load, and disk resources.

Using Exporters

On the computer where the PMM client is installed and connected to a PMM server, make use of the pmm-admin utility to add any built-in monitoring service directly. There is no extra effort in this case: the added monitoring service will run its exporter and all required configuration updates are made automatically to make the metrics available in the web interface for further analysis in Query analytics and Metrics monitor.

In case of external monitoring services, you need to locate, download, set up and run the specific Prometheus exporter to collect metrics. When it is ready, you can add it as a monitoring service:

pmm-admin add external:service job_name [instance] --service-port=PORT_NUMBER

This command adds an external monitoring service bound to the Prometheus job that you specify as the job_name parameter. You should also provide the port associated with this Prometheus job as the value of the service-port parameter. The instance parameter is optional. By default, it is assigned the name of the host where you run pmm-admin.

Example 1: Adding a PostgreSQL Monitoring Service

In order to add an external monitoring service for a PostgreSQL database server, make sure to install and configure your PostgreSQL server. Then, select a PostgreSQL Prometheus exporter from the list available from the  Prometheus site, such as PostgreSQL metric exporter for Prometheus. Refer to the documentation for this exporter for details about how to install and set it up.

As soon as your Prometheus exporter can collect metrics from your PostgreSQL database server,  you are ready to add this exporter as a monitoring service. Make sure that you have access to a configured PMM server and your PMM client has been set up to use it. Use the pmm-admin utility, which is part of PMM client, to add the PostgreSQL monitoring service. Assuming postgresql is the name of this monitoring service, your command should look like this:

pmm-admin add external:service --service-port=PORT_NUMBER postgresql

It is time now to display the metrics on the PMM Server. Open Metrics Monitor and check the Advanced Data Exploration dashboard. This can dashboard visualize a lot of metrics including those exposed by external monitoring services. In the Host field select your host. Use the Metric field to select a metric.

External Monitoring Services
Viewing a metric exposed by a PostgreSQL exporter.

Setting up an external monitoring service requires extra work compared to adding built-in monitoring services. However, by using external monitoring services you can considerably extend the capabilities of your PMM installation.

Note that running the pmm-admin list command lists the added external monitoring services. They also appear in the JSON output, too. To remove an external service use the remove (or its short form rm) command:

pmm-admin rm external:service --service-port=PORT_NUMBER NAME_OF_EXTERNAL_MONITORING_SERVICE

$ sudo pmm-admin list
pmm-admin 1.7.0
PMM Server      | 192.0.2.2 (password-protected)
Client Name     | postgres01
Client Address  | 192.0.2.3
Service Manager | unix-systemv
Job name    Scrape interval  Scrape timeout  Metrics path  Scheme  Target         Labels                   Health
postgresql  1s               1s              /metrics      http    192.0.2.3:9187 instance="postgres01"      UP

Example 2: Adding a Redis Monitoring Service

To start with, you must install a Prometheus exporter for Redis (this exporter is listed on the Prometheus Exporters and Integrations page) on the machine where your PMM client runs. The following command adds this exporter as an external monitoring service (run it as a superuser or use sudo). This time the command has an extra parameter:

$ sudo pmm-admin add external:service redis --service-port 9121 redis01
External service added.

Notice that we use Redis Server as the last parameter passed to pmm-admin add external:service command. The last positional parameter is a label that you assign to this particular instance.

pmm-admin add external:service --service-port=PORT_NUMBER NAME_OF_EXTERNAL_MONITORING_SERVICE [INSTANCE_LABEL]

You may choose any name for this purpose. Make sure to use quotes if you decide to use a label made of two or more words.

$ sudo pmm-admin list
pmm-admin 1.7.0
PMM Server | 127.0.0.1
Client Name | percona
Client Address | 172.17.0.1
Service Manager | linux-systemd
No services under monitoring.
Job name Scrape interval Scrape timeout Metrics path Scheme Target          Labels                  Health
redis    1m0s            10s            /metrics     http   172.17.0.1:9121 instance="redis01"      UP

To view Redis related metrics you need to open the Advanced Data Exploration dashboard on your PMM Server. The redis01 label automatically appears in the Host field in the Advanced Data Exploration dashboard. In the Host field, select the redis01 option and choose a metric to view from the Metric field, such as redis_exporter_scrapes_total.

Other Ways to Add External Services

The pmm-admin add external:service command is the recommended way to add an external monitoring service. There exist other, more specific, methods. The pmm-admin add external:metrics adds external Prometheus exporters job to metrics monitoring.

Feb
09
2018
--

Collect PostgreSQL Metrics with Percona Monitoring and Management (PMM)

Collecting PostgreSQL Information using Percona Monitoring and Management

In this article, we’ll describe how to collect PostgreSQL metrics with Percona Monitoring and Management (PMM).

We designed Percona Monitoring and Management (PMM) to be the best tool for MySQL and MongoDB performance investigation. At the same time, it’s built on mature opensource components: Prometheus’ time series database and Grafana. Starting from PMM 1.4.0. it’s possible to add monitoring for any service supported by Prometheus.

Demo

# install docker and docker-compose.
git clone https://github.com/ihanick/pmm-postgresql-demo.git
cd pmm-postgresql-demo
docker-compose build
docker-compose up

At this point, we are running exporter, PostgreSQL and the PMM server, but pmm-client on the PostgreSQL server isn’t configured.

docker-compose exec pg sh /root/initpmm.sh

Now we configured pmm client and added external exporter.

Let’s assume that you have executed commands above on the localhost. At this point we have several URLs:

We also need to create graphs for our new exporter. This could be done manually (import JSON), or you can import the existing dashboard Postgres_exporter published in the Grafana gallery by number in the catalog:

  1. Go to your PMM server web interface and press on the Grafana icon at the top left corner, then dashboards, the import.
  2. Copy and paste the dashboard ID from the Grafana site to “Grafana.com Dashboard” field, and press load.
  3. In the next dialog, choose Prometheus as a data source and continue.

PostgreSQL performance graphs can be seen at: http://localhost:8080/graph/dashboard/db/postgres_exporter?orgId=1

collect PostgreSQL metrics with Percona Monitoring and Management
PMM PostgreSQL postgres_exporter template


PMM-PostgreSQL Demo Under the Hood

To move this configuration to production, we need to understand how this demo works.

PMM Server

First of all, you need an existing PMM Server. You can find details on new server configuration at Deploying Percona Monitoring and Management.

In my demo I’m starting PMM without volumes, and all metrics dropped after using the docker-compose down command. Also, there is no need to use port 8080 for PMM, set it up with SSL support and password in production.

PostgreSQL Setup

I’m modifying the latest default PostgreSQL image to:

Of course, you can use a dedicated PostgreSQL server instead of one running inside a docker-compose sandbox. The only requirement is that the PMM server should be able to connect to this server.

User creation and permissions:

CREATE DATABASE postgres_exporter;
CREATE USER postgres_exporter PASSWORD 'password';
ALTER USER postgres_exporter SET SEARCH_PATH TO postgres_exporter,pg_catalog;
-- If deploying as non-superuser (for example in AWS RDS)
-- GRANT postgres_exporter TO :MASTER_USER;
CREATE SCHEMA postgres_exporter AUTHORIZATION postgres_exporter;
CREATE VIEW postgres_exporter.pg_stat_activity
AS
  SELECT * from pg_catalog.pg_stat_activity;
GRANT SELECT ON postgres_exporter.pg_stat_activity TO postgres_exporter;
CREATE VIEW postgres_exporter.pg_stat_replication AS
  SELECT * from pg_catalog.pg_stat_replication;
GRANT SELECT ON postgres_exporter.pg_stat_replication TO postgres_exporter;

To simplify setup, you can use a superuser account and access pg_catalog directly. To improve security, allow this user to connect only from exporter host.

PMM Client Setup on PostgreSQL Host

You can obtain database-only statistics with just the external exporter, and you can use any host with pmm-client installed. Fortunately, you can also export Linux metrics from the database host.

After installing the pmm-client package, you still need to configure the system. We should point it to the PMM server and register the external exporter (and optionally add the linux:metrics exporter).

#!/bin/sh
pmm-admin config --client-name pg1 --server pmm-server
pmm-admin add external:metrics postgresql pgexporter:9187
# optional
pmm-admin add linux:metrics
# other postgresql instances
pmm-admin add external:instances postgresql 172.18.0.3:9187

It’s important to keep the external exporter job name as “postgresql”, since all existing templates check it. There is a bit of inconsistency here: the first postgresql server is added as external:metrics, but all further servers should be added as external:instances.

The reason is the first command creates the Prometheus job and first instance, and further servers can be added without job creation.

PMM 1.7.0 external:service

Starting from PMM 1.7.0 the setup simplified if exporter located on the same host as pmm-client:

pmm-admin config --client-name pg1 --server pmm-server
pmm-admin add external:service --service-port=9187 postgresql

pmm-admin add external:metrics or pmm-admin add external:instances are not required if you are running exporter on the same host as pmm-client.

Exporter Setup

Exporter is a simple HTTP/HTTPS server returning one page. The format is:

curl -si http://172.17.0.4:9187/metrics|grep pg_static
# HELP pg_static Version string as reported by postgres
# TYPE pg_static untyped
pg_static{short_version="10.1.0",version="PostgreSQL 10.1 on x86_64-pc-linux-gnu, compiled by gcc (Debian 6.3.0-18) 6.3.0 20170516, 64-bit"} 1

As you can see, it’s a self-describing set of counters and string values. The Prometheus time series database built-in to PMM connects to the web server and stores the results on disk. There are multiple exporters available for PostgreSQL. postgres_exporter is listed as a third-party on the official Prometheus website.

You can compile exporter by yourself, or run it inside docker container. This and many other exporters are written in Go and compiled as a static binary so that you can copy the executable from the host with same CPU architecture. For production setups, you probably will run exporter from a database host directly and start the service with systemd.

In order to check network configuration issues, login to pmm-server and use the curl command from above. Do not forget to replace 172.17.0.4:9187 with the appropriate host:port (use the same IP address or DNS name as the pmm-admin add command).

You configure postgres_exporter with a single environment variable:

DATA_SOURCE_NAME=postgresql://postgres_exporter:password@pg:5432/postgres_exporter?sslmode=disable

Make sure that you provide the correct credentials, including the database name.

Run external exporter directly on database server

In order to simplify production setup, you can run exporter directly from the same server as you are using for running PostgreSQL.
This method allows you to use pmm-admin add external:service command recently added to PMM.

# Copy exporter binary from docker container to the local directory to skip build from sources
docker cp pmmpostgres_pgexporter_1:/postgres_exporter ./
# copy exporter binary to database host, use scp instead for existing database server.
docker cp postgres_exporter pmmpostgres_pg_1:/root/
# login to database server shell
docker exec -it pmmpostgres_pg_1 bash
# start exporter
DATA_SOURCE_NAME='postgresql://postgres_exporter:password@127.0.0.1:5432/postgres_exporter?sslmode=disable' ./postgres_exporter

Grafana Setup

In the demo, I’ve used Postgres_exporter dashboard. Use the same site and look for other PostgreSQL dashboards if you need more. The exporter provides many parameters, and not all of them are visualized in this dashboard.

For huge installations, you may find that filtering servers by “instance name” is not comfortable. Write your own JSON for the dashboard, or try to use one from demo repository. It’s the same as dashboard 3742, but uses the hostname for filtering and Prometheus job name in the legends.

All entries of instance=~"$instance" get replaced with instance=~"$host:.*".

The modification allows you to switch between PostgreSQL servers with host instead of “instance”, and see CPU and disk details for the current database server instead of the previously selected host.

Notice

This blog post on how to collect PostgreSQL metrics with Percona Monitoring and Management is not an official integration of PostgreSQL and PMM. I’ve tried to describe complex external exporters setup. Instead of PostgreSQL, you can use any other services and exporters with a similar setup, or even create your own exporter and instrument your application. It’s a great thing to see correlations between application activities and other system components like databases, web servers, etc.

Feb
06
2018
--

Announcing Experimental Percona Monitoring and Management (PMM) Functionality via Percona Labs

Experimental Percona Monitoring and Management

Experimental Percona Monitoring and ManagementIn this blog post, we’ll introduce how you can look at some experimental Percona Monitoring and Management (PMM) features using Percona Labs builds on GitHub.

Note: PerconaLabs and Percona-QA are open source GitHub repositories for unofficial scripts and tools created by Percona staff. While not covered by Percona support or services agreements, these handy utilities can help you save time and effort.

Percona software builds located in the PerconaLabs and Percona-QA repositories are not officially released software, and also aren’t covered by Percona support or services agreements. 

Percona Monitoring and Management (PMM) is a free and open-source platform for managing and monitoring MySQL® and MongoDB® performance. You can run PMM in your environment for maximum security and reliability. It provides thorough time-based analysis for MySQL and MongoDB servers to ensure that your data works as efficiently as possible.

This month we’re announcing access to Percona Labs builds of Percona Monitoring and Management so that you can experiment with new functionality that’s not yet in our mainline product. You can identify the unique builds at:

https://hub.docker.com/r/perconalab/pmm-server/tags/

Most of the entries here are the pre-release candidate images we use for QA, and they follow a format of all integers (for example “201802061627”). You’re fine to use these images, but they aren’t the ones that have the experimental functionality.

Today we have two builds of note (these DO have the experimental functionality):

  • 1.6.0-prom2.1
  • 1.5.3-prometheus2

We’re highlighting Prometheus 2.1 on top of our January 1.6 release (1.6.0-prom2.1), available in Docker format. Some of the reasons you might want to deploy this experimental build to take advantage of the Prometheus 2 benefits are:

  • Reduced CPU usage by Prometheus, meaning you can add more hosts to your PMM Server
  • Performance improvements, meaning dashboards load faster
  • Reduced disk I/O, disk space usage

Please keep in mind that as this is a Percona Labs build (see our note above), so in addition note the following two criteria:

  • Support is available from our Percona Monitoring and Management Forums
  • Upgrades might not work – don’t count on upgrading out of this version to a newer release (although it’s not guaranteed to block upgrades)

How to Deploy an Experimental Build from Percona Labs

The great news is that you can follow our Deployment Instructions for Docker, and the only change is where you specify a different Docker container to pull. For example, the standard way to deploy the latest stable PMM Server release with Docker is:

docker pull percona/pmm-server:latest

To use the Percona Labs build 1.6.0-prom2.1 with Prometheus 2.1, execute the following:

docker pull perconalab/pmm-server:1.6.0-prom2.1

Please share your feedback on this build on our Percona Monitoring and Management Forums.

If you’re looking to deploy Percona’s officially released PMM Server (not the Percona Labs release, but our mainline version which currently is release 1.7) into a production environment, I encourage you to consider a Percona Support contract, which includes PMM at no additional charge!

Jan
17
2018
--

Troubleshooting Percona Monitoring and Management (PMM) Metrics

In this blog post, I’ll look at some helpful tips on troubleshooting Percona Monitoring and Management metrics.

With any luck, Percona Monitoring and Management (PMM) works for you out of the box. Sometimes, however, things go awry and you see empty or broken graphs instead of dashboards full of insights.

Troubleshooting Percona Monitoring and Management Metrics 1

Before we go through troubleshooting steps, let’s talk about how data makes it to the Grafana dashboards in the first place. The PMM Architecture documentation page helps explain it:

Troubleshooting Percona Monitoring and Management Metrics 2

If we focus just on the “Metrics” path, we see the following requirements:

  • The appropriate “exporters” (Part of PMM Client) are running on the hosts you’re monitoring
  • The database is configured to expose all the metrics you’re looking for
  • The hosts are correctly configured in the repository on PMM Server side (stored in Consul)
  • Prometheus on the PMM Server side can scrape them successfully – meaning it can reach them successfully, does not encounter any timeouts and has enough resources to ingest all the provided data
  • The exporters can retrieve metrics that they requested (i.e., there are no permissions problems)
  • Grafana can retrieve the metrics stored in Prometheus Server and display them

Now that we understand the basic requirements let’s look at troubleshooting the tool.

PMM Client

First, you need to check if the services are actually configured properly and running:

root@rocky:/mnt/data# pmm-admin list
pmm-admin 1.5.2
PMM Server      | 10.11.13.140
Client Name     | rocky
Client Address  | 10.11.13.141
Service Manager | linux-systemd
-------------- ------ ----------- -------- ------------------------------------------- ------------------------------------------
SERVICE TYPE   NAME   LOCAL PORT  RUNNING  DATA SOURCE                                 OPTIONS
-------------- ------ ----------- -------- ------------------------------------------- ------------------------------------------
mysql:queries  rocky  -           YES      root:***@unix(/var/run/mysqld/mysqld.sock)  query_source=slowlog, query_examples=true
linux:metrics  rocky  42000       YES      -
mysql:metrics  rocky  42002       YES      root:***@unix(/var/run/mysqld/mysqld.sock)

Second, you can also instruct the PMM client to perform basic network checks. These can spot connectivity problems, time drift and other issues:

root@rocky:/mnt/data# pmm-admin check-network
PMM Network Status
Server Address | 10.11.13.140
Client Address | 10.11.13.141
* System Time
NTP Server (0.pool.ntp.org)         | 2018-01-06 09:10:33 -0500 EST
PMM Server                          | 2018-01-06 14:10:33 +0000 GMT
PMM Client                          | 2018-01-06 09:10:33 -0500 EST
PMM Server Time Drift               | OK
PMM Client Time Drift               | OK
PMM Client to PMM Server Time Drift | OK
* Connection: Client --> Server
-------------------- -------
SERVER SERVICE       STATUS
-------------------- -------
Consul API           OK
Prometheus API       OK
Query Analytics API  OK
Connection duration | 355.085µs
Request duration    | 938.121µs
Full round trip     | 1.293206ms
* Connection: Client <-- Server
-------------- ------ ------------------- ------- ---------- ---------
SERVICE TYPE   NAME   REMOTE ENDPOINT     STATUS  HTTPS/TLS  PASSWORD
-------------- ------ ------------------- ------- ---------- ---------
linux:metrics  rocky  10.11.13.141:42000  OK      YES        -
mysql:metrics  rocky  10.11.13.141:42002  OK      YES        -

If everything is working, next we can check if exporters are providing the expected data directly.

Checking Prometheus Exporters

Looking at the output from pmm-admin check-network, we can see the “REMOTE ENDPOINT”. This shows the exporter address, which you can use to access it directly in your browser:

Troubleshooting Percona Monitoring and Management Metrics 3

You can see MySQL Exporter has different sets of metrics for high, medium and low resolution, and you can click on them to see the provided metrics:

Troubleshooting Percona Monitoring and Management Metrics 4

There are few possible problems you may encounter at this stage

  • You do not see the metrics you expect to seeThis could be a configuration issue on the database side (docs for MySQL and MongoDB), permissions errors or exporter not being correctly configured to expose the needed metrics.
  • Page takes too long to load. This could mean the data capture is too expensive for your configuration. For example, if you have a million tables, you probably can’t afford to capture per-table data.

mysql_exporter_collector_duration_seconds is a great metric that allows you to see which collectors are enabled for different resolutions, and how much time it takes for a given collector to execute. This way you can find and potentially disable collectors that are too expensive for your environment.

Let’s look at some more advanced ways to troubleshoot exporters.  

Looking at ProcessList

root@rocky:/mnt/data# ps aux | grep mysqld_exporter
root      1697  0.0  0.0   4508   848 ?        Ss    2017   0:00 /bin/sh -c
/usr/local/percona/pmm-client/mysqld_exporter -collect.auto_increment.columns=true
-collect.binlog_size=true -collect.global_status=true -collect.global_variables=true
-collect.info_schema.innodb_metrics=true -collect.info_schema.processlist=true
-collect.info_schema.query_response_time=true -collect.info_schema.tables=true
-collect.info_schema.tablestats=true -collect.info_schema.userstats=true
-collect.perf_schema.eventswaits=true -collect.perf_schema.file_events=true
-collect.perf_schema.indexiowaits=true -collect.perf_schema.tableiowaits=true
-collect.perf_schema.tablelocks=true -collect.slave_status=true
-web.listen-address=10.11.13.141:42002 -web.auth-file=/usr/local/percona/pmm-client/pmm.yml
-web.ssl-cert-file=/usr/local/percona/pmm-client/server.crt
-web.ssl-key-file=/usr/local/percona/pmm-client/server.key >>
/var/log/pmm-mysql-metrics-42002.log 2>&1

This shows us that the exporter is running, as well as specific command line options that were used to start it (which collectors were enabled, for example).

Checking out Log File

root@rocky:/mnt/data# tail /var/log/pmm-mysql-metrics-42002.log
time="2018-01-05T18:19:10-05:00" level=error msg="Error pinging mysqld: dial unix
/var/run/mysqld/mysqld.sock: connect: no such file or directory" source="mysqld_exporter.go:442"
time="2018-01-05T18:19:11-05:00" level=error msg="Error pinging mysqld: dial unix
/var/run/mysqld/mysqld.sock: connect: no such file or directory" source="mysqld_exporter.go:442"
time="2018-01-05T18:19:12-05:00" level=error msg="Error pinging mysqld: dial unix
/var/run/mysqld/mysqld.sock: connect: no such file or directory" source="mysqld_exporter.go:492"
time="2018-01-05T18:19:12-05:00" level=error msg="Error pinging mysqld: dial unix
/var/run/mysqld/mysqld.sock: connect: no such file or directory" source="mysqld_exporter.go:442"
time="2018-01-05T18:19:12-05:00" level=error msg="Error pinging mysqld: dial unix
/var/run/mysqld/mysqld.sock: connect: no such file or directory" source="mysqld_exporter.go:616"
time="2018-01-05T18:19:13-05:00" level=error msg="Error pinging mysqld: dial unix
/var/run/mysqld/mysqld.sock: connect: no such file or directory" source="mysqld_exporter.go:442"
time="2018-01-05T18:19:14-05:00" level=error msg="Error pinging mysqld: dial unix
/var/run/mysqld/mysqld.sock: connect: no such file or directory" source="mysqld_exporter.go:442"
time="2018-01-05T18:19:15-05:00" level=error msg="Error pinging mysqld: dial unix
/var/run/mysqld/mysqld.sock: connect: no such file or directory" source="mysqld_exporter.go:442"
time="2018-01-05T18:19:16-05:00" level=error msg="Error pinging mysqld: dial unix
/var/run/mysqld/mysqld.sock: connect: no such file or directory" source="mysqld_exporter.go:442"
2018/01/06 09:10:33 http: TLS handshake error from 10.11.13.141:56154: tls: first record does not look like a TLS handshake

If you have problems such as authentication or permission errors, you will see them in the log file. In the example above, we can see the exporter reporting many connection errors (the MySQL Server was down).

Prometheus Server

Next, we can take a look at the Prometheus Server. It is exposed in PMM Server at /prometheus path. We can go to Status->Targets to see which Targets are configured and if they are working: correctly

Troubleshooting Percona Monitoring and Management Metrics 5

In this example, some hosts are scraped successfully while others are not. As you can see I have some hosts that are down, so scraping fails with “no route to host”. You might also see problems caused by firewall configurations and other reasons.

The next area to check, especially if you have gaps in your graph, is if your Prometheus server has enough resources to ingest all the data reported in your environment. Percona Monitoring and  Management ships with the Prometheus dashboard to help to answer this question (see demo).

There is a lot of information in this dashboard, but one of the most important areas you should check is if there is enough CPU available for Prometheus:

Troubleshooting Percona Monitoring and Management Metrics 6

The most typical problem to have with Prometheus is getting into “Rushed Mode” and dropping some of the metrics data:

Troubleshooting Percona Monitoring and Management Metrics 7

Not using enough memory to buffer metrics is another issue, which is shown as “Configured Target Storage Heap Size” on the graph:

Troubleshooting Percona Monitoring and Management Metrics 8

Values of around 40% of total memory size often make sense. The PMM FAQ details how to tune this setting.

If the amount of memory is already configured correctly, you can explore upgrading to a more powerful instance size or reducing the number of metrics Prometheus ingests. This can be done either by adjusting Metrics Resolution (as explained in FAQ) or disabling some of the collectors (Manual). 

You might wonder which collectors generate the most data? This information is available on the same Prometheus Dashboard:

Troubleshooting Percona Monitoring and Management Metrics 9

While these aren’t not exact values, they correlate very well with what the load collectors generate. In this case, for example, we can see that the Performance Schema is responsible for a large amount of time series data. As such, disabling its collectors can reduce the Prometheus load substantially.

Hopefully, these troubleshooting steps were helpful to you in diagnosing PMM’s metrics capture. In a later blog post, I will write about how to diagnose problems with Query Analytics (Demo).

Jan
16
2018
--

Webinar January 18, 2018: MySQL Troubleshooting and Performance Optimization with Percona Monitoring and Management (PMM) Part 2

Percona Monitoring and Management

Percona Monitoring and ManagementJoin Percona’s Product Manager Michael Coburn as he presents MySQL Troubleshooting and Performance Optimization with Percona Monitoring and Management (PMM) Part 2 on Thursday, January 18, 2018, at 11:00 am PST / 2:00 pm EST (UTC-8).

Tags: Percona Monitoring and Management, PMM, Monitoring, MySQL, Performance, Optimization, DBA, SysAdmin, DevOps
Experience Level: Expert

Optimizing MySQL performance and troubleshooting MySQL problems are two of the most critical and challenging tasks for MySQL DBAs. The databases powering your applications need to handle heavy traffic loads while remaining responsive and stable. This is so that you can deliver an excellent user experience. Furthermore, DBA’s are also expected to find cost-efficient means of solving these issues.

In this webinar — the second part of a two-part series — Michael discusses how you can optimize and troubleshoot MySQL performance and demonstrate how Percona Monitoring and Management (PMM) enables you to solve these challenges using free and open source software. We will look at specific, common MySQL problems and review the essential components in PMM that allow you to diagnose and resolve them.

By the end of this webinar, you will have a better understanding of how you can troubleshoot MySQL problems in your database.

Register for the webinar now.

Percona Monitoring and ManagementMichael Coburn, Product Manager

Michael joined Percona as a Consultant in 2012 and progressed through various roles including Managing Consultant, Principal Architect, Technical Account Manager, and Technical Support Engineer. He is now leading the Product Manager of Percona Monitoring and Management.

Powered by WordPress | Theme: Aeros 2.0 by TheBuckmaker.com