 This post explains how to perform a Rolling Index Build on a Kubernetes environment running Percona Operator for MongoDB. Why and when to perform a Rolling Index Build? Building an index requires: CPU and I/O resources Database locks (even if brief) Network bandwidth If you have very tight SLAs or systems that are already operating […]
Jul
28
2025
28
2025
--
How to Perform Rolling Index Builds with Percona Operator for MongoDB
Nov
19
2024
19
2024
--
Using Loki and Promtail to Display PostgreSQL Logs From a Kubernetes Cluster in PMM
 This is a follow-up to my colleagues Nickolay and Phong’s Store and Manage Logs of Percona Operator Pods with PMM and Grafana Loki and Agustin’s Turbocharging Percona Monitoring and Management With Loki’s Log-shipping Functionality blog posts. Here, I focus on making PostgreSQL database logs from a Kubernetes cluster deployed with the Percona Operator for PostgreSQL […]
Jul
08
2024
08
2024
--
Automated Major Version Upgrades in Percona Operator for PostgreSQL
 PostgreSQL major versions are released every year, with each release delivering better performance and new features. With such rapid innovation, it is inevitable that there will be a need to upgrade from one version to another. Upgrade procedures are usually very complex and require thorough planning. With the 2.4.0 release of Percona Operator for PostgreSQL, […]
Mar
20
2023
20
2023
--
Comparisons of Proxies for MySQL

With a special focus on Percona Operator for MySQL
Overview
HAProxy, ProxySQL, MySQL Router (AKA MySQL Proxy); in the last few years, I had to answer multiple times on what proxy to use and in what scenario. When designing an architecture, many components need to be considered before deciding on the best solution.
When deciding what to pick, there are many things to consider, like where the proxy needs to be, if it “just” needs to redirect the connections, or if more features need to be in, like caching and filtering, or if it needs to be integrated with some MySQL embedded automation.
Given that, there never was a single straight answer. Instead, an analysis needs to be done. Only after a better understanding of the environment, the needs, and the evolution that the platform needs to achieve is it possible to decide what will be the better choice.
However, recently we have seen an increase in the usage of MySQL on Kubernetes, especially with the adoption of Percona Operator for MySQL. In this case, we have a quite well-defined scenario that can resemble the image below:

In this scenario, the proxies must sit inside Pods, balancing the incoming traffic from the Service LoadBalancer connecting with the active data nodes.
Their role is merely to be sure that any incoming connection is redirected to nodes that can serve them, which includes having a separation between Read/Write and Read Only traffic, a separation that can be achieved, at the service level, with automatic recognition or with two separate entry points.
In this scenario, it is also crucial to be efficient in resource utilization and scaling with frugality. In this context, features like filtering, firewalling, or caching are redundant and may consume resources that could be allocated to scaling. Those are also features that will work better outside the K8s/Operator cluster, given the closer to the application they are located, the better they will serve.
About that, we must always remember the concept that each K8s/Operator cluster needs to be seen as a single service, not as a real cluster. In short, each cluster is, in reality, a single database with high availability and other functionalities built in.
Anyhow, we are here to talk about Proxies. Once we have defined that we have one clear mandate in mind, we need to identify which product allows our K8s/Operator solution to:
- Scale at the maximum the number of incoming connections
- Serve the request with the higher efficiency
- Consume as fewer resources as possible
The environment
To identify the above points, I have simulated a possible K8s/Operator environment, creating:
- One powerful application node, where I run sysbench read-only tests, scaling from two to 4096 threads. (Type c5.4xlarge)
- Three mid-data nodes with several gigabytes of data in with MySQL and Group Replication (Type m5.xlarge)
- One proxy node running on a resource-limited box (Type t2.micro)
The tests
We will have very simple test cases. The first one has the scope to define the baseline, identifying the moment when we will have the first level of saturation due to the number of connections. In this case, we will increase the number of connections and keep a low number of operations.
The second test will define how well the increasing load is served inside the previously identified range.
For documentation, the sysbench commands are:
Test1
sysbench ./src/lua/windmills/oltp_read.lua  --db-driver=mysql --tables=200 --table_size=1000000
 --rand-type=zipfian --rand-zipfian-exp=0 --skip_trx=true  --report-interval=1 --mysql-ignore-errors=all
--mysql_storage_engine=innodb --auto_inc=off --histogram  --stats_format=csv --db-ps-mode=disable --point-selects=50
--reconnect=10 --range-selects=true –rate=100 --threads=<#Threads from 2 to 4096> --time=1200 run
Test2
sysbench ./src/lua/windmills/oltp_read.lua  --mysql-host=<host> --mysql-port=<port> --mysql-user=<user>
--mysql-password=<pw> --mysql-db=<schema> --db-driver=mysql --tables=200 --table_size=1000000  --rand-type=zipfian
--rand-zipfian-exp=0 --skip_trx=true  --report-interval=1 --mysql-ignore-errors=all --mysql_storage_engine=innodb
--auto_inc=off --histogram --table_name=<tablename>  --stats_format=csv --db-ps-mode=disable --point-selects=50
--reconnect=10 --range-selects=true --threads=<#Threads from 2 to 4096> --time=1200 run
Results
Test 1
As indicated here, I was looking to identify when the first Proxy will reach a dimension that would not be manageable. The load is all in creating and serving the connections, while the number of operations is capped at 100.

As you can see, and as I was expecting, the three Proxies were behaving more or less the same, serving the same number of operations (they were capped, so why not) until they weren’t.
MySQL router, after the 2048 connection, could not serve anything more.
NOTE: MySQL Router actually stopped working at 1024 threads, but using version 8.0.32, I enabled the feature: connection_sharing. That allows it to go a bit further.
Let us take a look also the latency:

Here the situation starts to be a little bit more complicated. MySQL Router is the one that has the higher latency no matter what. However, HAProxy and ProxySQL have interesting behavior. HAProxy performs better with a low number of connections, while ProxySQL performs better when a high number of connections is in place.
This is due to the multiplexing and the very efficient way ProxySQL uses to deal with high load.
Everything has a cost:

HAProxy is definitely using fewer user CPU resources than ProxySQL or MySQL Router …

.. we can also notice that HAProxy barely reaches, on average, the 1.5 CPU load while ProxySQL is at 2.50 and MySQL Router around 2.
To be honest, I was expecting something like this, given ProxySQL’s need to handle the connections and the other basic routing. What was instead a surprise was MySQL Router, why does it have a higher load?
Brief summary
This test highlights that HAProxy and ProxySQL can reach a level of connection higher than the slowest runner in the game (MySQL Router). It is also clear that traffic is better served under a high number of connections by ProxySQL, but it requires more resources.
Test 2
When the going gets tough, the tough get going
Let’s remove the –rate limitation and see what will happen.

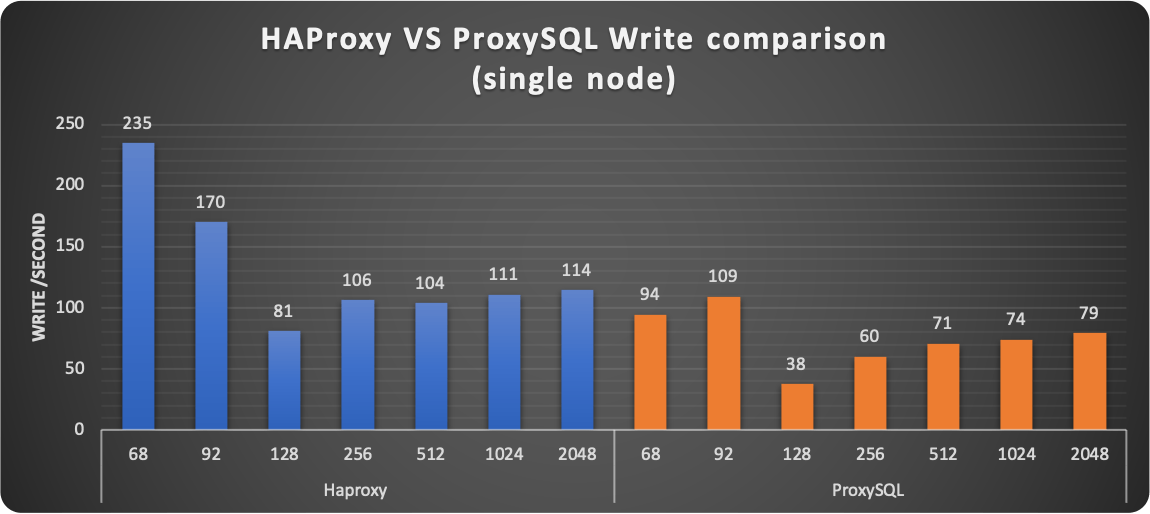
The scenario with load changes drastically. We can see how HAProxy can serve the connection and allow the execution of more operations for the whole test. ProxySQL is immediately after it and behaves quite well, up to 128 threads, then it just collapses.
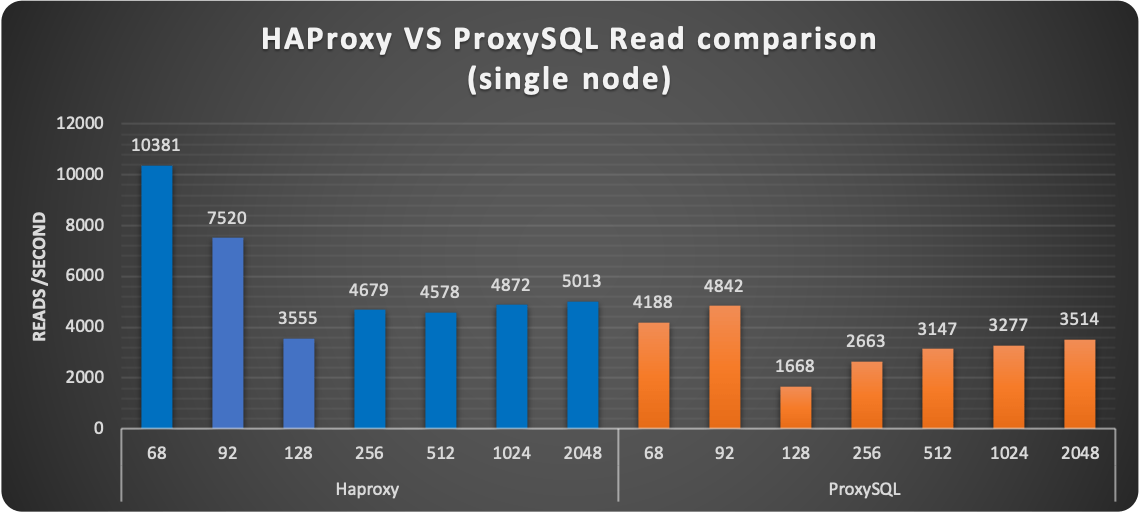
MySQL Router never takes off; it always stays below the 1k reads/second, while HAProxy served 8.2k and ProxySQL 6.6k.

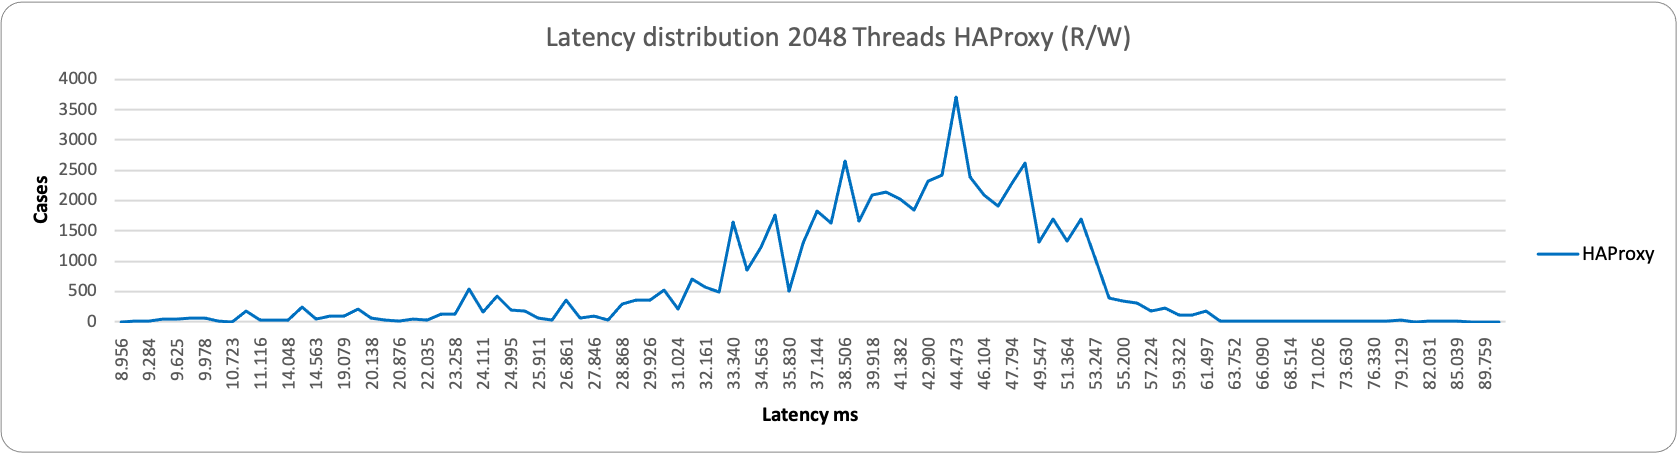
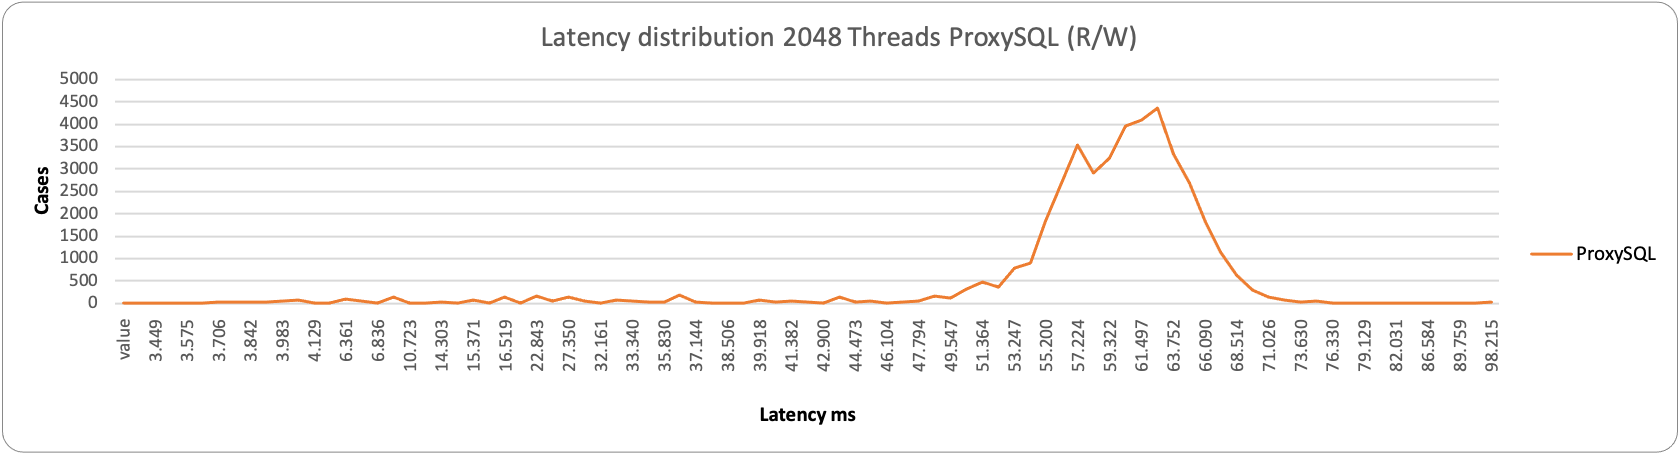
Looking at the latency, we can see that HAProxy gradually increased as expected, while ProxySQL and MySQL Router just went up from the 256 threads on.
To observe that both ProxySQL and MySQL Router could not complete the tests with 4096 threads.

Why? HAProxy always stays below 50% CPU, no matter the increasing number of threads/connections, scaling the load very efficiently. MySQL router was almost immediately reaching the saturation point, being affected by the number of threads/connections and the number of operations. That was unexpected, given we do not have a level 7 capability in MySQL Router.
Finally, ProxySQL, which was working fine up to a certain limit, reached saturation point and could not serve the load. I am saying load because ProxySQL is a level 7 proxy and is aware of the content of the load. Given that, on top of multiplexing, additional resource consumption was expected.

Here we just have a clear confirmation of what was already said above, with 100% CPU utilization reached by MySQL Router with just 16 threads, and ProxySQL way after at 256 threads.
Brief summary
HAProxy comes up as the champion in this test; there is no doubt that it could scale the increasing load in connection without being affected significantly by the load generated by the requests. The lower consumption in resources also indicates the possible space for even more scaling.
ProxySQL was penalized by the limited resources, but this was the game, we had to get the most out of the few available. This test indicates that it is not optimal to use ProxySQL inside the Operator; it is a wrong choice if low resource and scalability are a must.
MySQL Router was never in the game. Unless a serious refactoring, MySQL Router is designed for very limited scalability, as such, the only way to adopt it is to have many of them at the application node level. Utilizing it close to the data nodes in a centralized position is a mistake.
Conclusions
I started showing an image of how the MySQL service is organized and want to close by showing the variation that, for me, is the one to be considered the default approach:

This highlights that we must always choose the right tool for the job.
The Proxy in architectures involving MySQL/Percona Server for MySQL/Percona XtraDB Cluster is a crucial element for the scalability of the cluster, no matter if using K8s or not. Choosing the one that serves us better is important, which can sometimes be ProxySQL over HAProxy.
However, when talking about K8s and Operators, we must recognize the need to optimize the resources usage for the specific service. In that context, there is no discussion about it, HAProxy is the best solution and the one we should go to.
My final observation is about MySQL Router (aka MySQL Proxy).
Unless there is a significant refactoring of the product, at the moment, it is not even close to what the other two can do. From the tests done so far, it requires a complete reshaping, starting to identify why it is so subject to the load coming from the query more than the load coming from the connections.
Great MySQL to everyone.
References
Oct
13
2022
13
2022
--
Run PostgreSQL in Kubernetes: Solutions, Pros and Cons

PostgreSQL’s initial release was in 1996 when cloud-native was not even a term. Right now it is the second most popular relational open source database according to DB-engines. With its popularity growth and the rising trend of Kubernetes, it is not a surprise that there are multiple solutions to run PostgreSQL on K8s.
In this blog post, we are going to compare these solutions and review the pros and cons of each of them. The solutions under our microscope are:
- Crunchy Data PostgreSQL Operator (PGO)
- CloudNative PG from Enterprise DB
- Stackgres from OnGres
- Zalando Postgres Operator
- Percona Operator for PostgreSQL
The summary and comparison table can be found in our documentation.
Crunchy Data PGO
Crunchy Data is a company well-known in the PostgreSQL community. They provide a wide range of services and software solutions for PG. Their PostgreSQL Operator (PGO) is fully open source (Apache 2.0 license), but at the same time container images used by the operator are shipped under Crunchy Data Developer Program. This means that you cannot use the Operator with these images in production without the contract with Crunchy Data. Read more in the Terms of Use.
Deployment
According to the documentation, the latest version of the operator is 5.2.0, but the latest tag in Github is 4.7.7. I was not able to find which version is ready for production, but I will use a quickstart installation from the GitHub page, which installs 5.2.0. The quick start is not that quick. First, you need to fork the repository with examples: link.
Executing these commands failed for me:
YOUR_GITHUB_UN="<your GitHub username>"
git clone --depth 1 "git@github.com:${YOUR_GITHUB_UN}/postgres-operator-examples.git"
cd postgres-operator-examples

Cloning into 'postgres-operator-examples'...
git@github.com: Permission denied (publickey).
fatal: Could not read from remote repository.
I just ended up cloning the repo with
git clone --depth 1 https://github.com/spron-in/postgres-operator-examples
Ran kustomize script which failed as well:
$ kubectl apply -k kustomize/install
error: unable to find one of 'kustomization.yaml', 'kustomization.yml' or 'Kustomization' in directory '/home/percona/postgres-operator-examples/kustomize/install'
The instructions on the documentation page have other commands, so I used them instead. As a person who loves open source, I sent a PR to fix the doc on Github.
kubectl apply -k kustomize/install/namespace
kubectl apply --server-side -k kustomize/install/default
Now Operator is installed. Install the cluster:
kubectl apply -k kustomize/postgres/
Features
PGO operator is used in production by various companies, comes with management capabilities, and allows users to fine-tune PostgreSQL clusters.
No need to go through the regular day-two operations, like backups and scaling. The following features are quite interesting:
- Extension Management. PostgreSQL extensions expand the capabilities of the database. With PGO, you can easily add extensions for your cluster and configure them during bootstrap. I like the simplicity of this approach.
- User / database management. Create users and databases during cluster initialization. This is very handy for CICD pipelines and various automations.
- Backup with annotations. Usually, Operators come with a separate Custom Resource Definition for backups and restores. In the case of PGO, backups, and restores are managed through annotations. This is an antipattern but still follows the declarative form.
CloudNative PG
This operator was maturing in EnterpriseDB (EDB) to be finally open-sourced recently. It is Apache-licensed and fully open source, and there is an EDB Postgres operator, which is a fork based on CloudNative PG. The Enterprise version has some additional features, for example, support for Red Hat OpenShift.
Deployment
Using quickstart, here is how to install the Operator:
kubectl apply -f \ https://raw.githubusercontent.com/cloudnative-pg/cloudnative-pg/release-1.17/releases/cnpg-1.17.0.yaml
It automatically creates
cnpg-system
namespace and deploys necessary CRDs, service accounts, and more.
Once done, you can deploy the PostgreSQL cluster. There are multiple exampolary YAMLs.
kubectl apply -f https://cloudnative-pg.io/documentation/1.17/samples/cluster-example.yaml
There is also a helm chart available that can simplify the installation even more.
Features
CloudNative PG comes with a wide range of regular operational capabilities: backups, scaling, and upgrades. The architecture of the Operator is quite interesting:
- No StatefulSets. Normally, you would see StatefulSets used for stateful workloads in Kubernetes. Here PostgreSQL cluster is deployed with standalone Pods which are fully controlled by the Operator.
- No Patroni. Patroni is a de-facto standard in the PostgreSQL community to build highly available clusters. Instead, they use Postgres instance manager.
- Barman for backups. Not a usual choice as well, but can be explained by the fact that pgBarman, a backup tool for PostgreSQL, was developed by the 2nd Quadrant team which was acquired by EDB.
Apart from architecture decisions, there are some things that I found quite refreshing:
- Documentation. As a product manager, I’m honestly fascinated by their documentation. It is very detailed, goes deep into details, and is full of various examples covering a wide variety of use cases.
- The custom resource which is used to create the cluster is called “Cluster”. It is a bit weird, but running something like kubectl get cluster is kinda cool.
- You can bootstrap the new cluster, from an existing backup object and use streaming replication from the existing PostgreSQL cluster, even from outside Kubernetes. Useful for CICD and migrations.
Stackgres
OnGres is a company providing its support, professional, and managed services for PostgreSQL. The operator – Stackgres – is licensed under AGPL v3.
Deployment
Installation is super simple and described on the website. It boils down to a single command:
kubectl apply -f 'https://sgres.io/install'
This will deploy the web user interface and the operator. The recommended way to deploy and manage clusters is through the UI. Get the login and password:
kubectl get secret -n stackgres stackgres-restapi --template '{{ printf "username = %s\n" (.data.k8sUsername | base64decode) }}'
kubectl get secret -n stackgres stackgres-restapi --template '{{ printf "password = %s\n" (.data.clearPassword | base64decode) }}'
Connect to the UI. You can either expose the UI through a LoadBalancer or with Kubernetes port forwarding:
POD_NAME=$(kubectl get pods --namespace stackgres -l "app=stackgres-restapi" -o jsonpath="{.items[0].metadata.name}")
kubectl port-forward ${POD_NAME} --address 0.0.0.0 8443:9443 --namespace stackgres
Deployment of the cluster in the UI is quite straightforward and I will not cover it here.
Features
UI allows users to scale, backup, restore, clone, and perform various other tasks with the clusters. I found it a bit hard to debug issues. It is recommended to set up a log server and debug issues on it, but I have not tried it. But the UI itself is mature, flexible, and just nice!
Interesting ones:
- Experimental Babelfish support that enables the migration from MSSQL to save on license costs.
- Extension management system, where users can choose the extension and its version to expand PG cluster capabilities.

- To perform upgrades, Vacuum, and other database activities, the Operator provides Database Operation capability. It also has built-in benchmarking, which is cool!

Zalando Postgres Operator
Zalando is an online retailer of shoes, fashion, and beauty. It is the only company in this blog post that is not database-focused. They open-sourced the Operator that they use internally to run and manage PostgreSQL databases and it is quite widely adopted. It is worth mentioning that the Zalando team developed and open-sourced Patroni, which is widely adopted and used.
Deployment
You can deploy Zalando Operator through a helm chart or with kubectl. Same as with Stackgres, this Operator has a built-in web UI.
Helm chart installation is the quickest and easiest way to get everything up and running:
# add repo for postgres-operator
helm repo add postgres-operator-charts https://opensource.zalando.com/postgres-operator/charts/postgres-operator

# install the postgres-operator
helm install postgres-operator postgres-operator-charts/postgres-operator

# add repo for postgres-operator-ui
helm repo add postgres-operator-ui-charts https://opensource.zalando.com/postgres-operator/charts/postgres-operator-ui

# install the postgres-operator-ui
helm install postgres-operator-ui postgres-operator-ui-charts/postgres-operator-ui
Expose the UI:
kubectl port-forward svc/postgres-operator-ui 8081:80
Connect to the UI and create the cluster.
Features
This is one of the oldest PostgreSQL Operators, over time its functionality was expanding. It supports backups and restores, major version upgrades, and much more. Also, it has a web-based user interface to ease onboarding.
- The operator heavily relies on Spilo – docker image that provides PostgreSQL and Patroni bundled together. It was developed in Zalando as well. This is a centerpiece to build HA architecture.
- As Zalando is using AWS for its infrastructure, the operator is heavily tested and can be integrated with AWS. You can see it in some features – like live volume resize for AWS EBS or gp2 to gp3 migration.
Percona Operator for PostgreSQL
Percona is committed to providing software and services for databases anywhere. Kubernetes is a de-facto standard for cloud-native workloads that helps with this commitment.
What are the most important things about our Operator:
- Fully open source
- Supported by the community and Percona team. If you have a contract with Percona, you are fully covered with our exceptional services.
- It is based on the Crunchy Data PGO v 4.7 with enhancements for monitoring, upgradability, and flexibility
Deployment
We have quick-start installation guides through helm and regular YAML manifests. The installation through helm is as follows:
Install the Operator:
helm repo add percona https://percona.github.io/percona-helm-charts/
helm install my-operator percona/pg-operator --version 1.3.0
Deploy PostgreSQL cluster:
helm install my-db percona/pg-db --version 1.3.0
Features
Most of the features are inherited from Crunchy Data – backups, scaling, multi-cluster replication, and many more.
-
- Open Source. Compared to Crunchy Data PGO, we do not impose any limitations on container images, so it is fully open source and can be used without any restrictions in production.
- Percona Monitoring and Management (PMM) is an open source database monitoring, observability, and management tool. Percona Operators come with an integration with PMM, so that users get full visibility into the health of their databases.
- Automated Smart Upgrades. Our Operator not only allows users to upgrade the database but also does it automatically and in a safe, zero-downtime way.
- One-stop shop. Today’s enterprise environment is multi-database by default. Percona can help companies run PostgreSQL, MySQL, and MongoDB databases workloads over Kubernetes in a comprehensive manner.
To keep you excited, we are working on version two of the operator. It will have an improved architecture, remove existing limitations for backups and restores, enable automated scaling for storage and resources, and more. This quarter we plan to release a beta version, keep an eye on our releases.
Conclusion
PostgreSQL in Kubernetes is not a necessary evil, but an evolutionary step for companies who chose k8s as their platform. Choosing a vendor and a solution – is an important technical decision, which might impact various business metrics in the future. Still confused with various choices? Please start a discussion on the forum or contact our team directly.
The Percona Kubernetes Operators automate the creation, alteration, or deletion of members in your Percona Distribution for MySQL, MongoDB, or PostgreSQL environment.
Apr
12
2022
12
2022
--
Face to Face with Semi-Synchronous Replication

 Last month I performed a review of the Percona Operator for MySQL Server which is still Alpha. That operator is based on Percona Server for MySQL and uses standard asynchronous replication, with the option to activate semi-synchronous replication to gain higher levels of data consistency between nodes.
The whole solution is composed as:

Additionally, Orchestrator (https://github.com/openark/orchestrator) is used to manage the topology and the settings to enable on the replica nodes, the semi-synchronous flag if required. While we have not too much to say when using standard Asynchronous replication, I want to write a few words on the needs and expectations of the semi-synchronous (semi-sync) solution.
A Look into Semi-Synchronous
Difference between Async and Semi-sync.
Asynchronous:

The above diagram represents the standard asynchronous replication. This method is expected by design, to have transactions committed on the Source that are not present on the Replicas. The Replica is supposed to catch up when possible.
It is also important to understand that there are two steps in replication:
- Data copy, which is normally very fast. The Data is copied from the binlog of the Source to the relay log on the Replica (IO_Thread).
- Data apply, where the data is read from the relay log on the Replica node and written inside the database itself (SQL_Thread). This step is normally the bottleneck and while there are some parameters to tune, the efficiency to apply transactions depends on many factors including schema design.
Production deployments that utilize the Asynchronous solution are typically designed to manage the possible inconsistent scenario given data on Source is not supposed to be on Replica at commit. At the same time, the level of High Availability assigned to this solution is lower than the one we normally obtain with (virtually-)synchronous replication, given we may need to wait for the Replicate to catch up on the gap accumulated in the relay-logs before performing the fail-over.
Semi-sync:

The above diagram represents the Semi-sync replication method. The introduction of semi-sync adds a checking step on the Source before it returns the acknowledgment to the client. This step happens at the moment of the data-copy, so when the data is copied from the Binary-log on Source to the Relay-log on Replica.
This is important, there is NO mechanism to ensure a more resilient or efficient data replication, there is only an additional step, that tells the Source to wait a given amount of time for an answer from N replicas, and then return the acknowledgment or timeout and return to the client no matter what.
This mechanism is introducing a possible significant delay in the service, without giving a 100% guarantee of data consistency.
In terms of availability of the service, when in presence of a high load, this method may lead the Source to stop serving the request while waiting for acknowledgments, significantly reducing the availability of the service itself.
At the same time, the only acceptable setting for rpl_semi_sync_source_wait_point is AFTER_SYNC (default) is because: In the event of source failure, all transactions committed on the source have been replicated to the replica (saved to its relay log). An unexpected exit of the source server and failover to the replica is lossless because the replica is up to date.
All clear? No? Let me simplify the thing.
- In standard replication, you have two moments (I am simplifying)
- Copy data from Source to Replica
- Apply data in the Replica node
- There is no certification on the data applied about its consistency with the Source
- With asynchronous the Source task is to write data in the binlog and forget
- With semi-sync, the Source writes the data on binlog and waits T seconds to receive an acknowledgment from N servers about them having received the data.
To enable semi-sync you follow these steps: https://dev.mysql.com/doc/refman/8.0/en/replication-semisync-installation.html
In short:
- Register the plugins
- Enable Source rpl_semi_sync_source_enabled=1
- Enable Replica rpl_semi_sync_replica_enabled = 1
- If replication is already running STOP/START REPLICA IO_THREAD
And here starts the fun, be ready for many “wait whaaat?”.
What are the T and N I have just mentioned above?
Well, the T is a timeout that you can set to avoid having the source wait forever for the Replica acknowledgment. The default is 10 seconds. What happens if the Source waits for more than the timeout? 
rpl_semi_sync_source_timeout controls how long the source waits on a commit for acknowledgment from a replica before timing out and reverting to asynchronous replication.
Careful of the wording here! The manual says SOURCE, so it is not that MySQL revert to asynchronous, by transaction or connection, it is for the whole server.
Now analyzing the work-log (see https://dev.mysql.com/worklog/task/?id=1720 and more in the references) the Source should revert to semi-synchronous as soon as all involved replicas are aligned again.
However, checking the code (see https://github.com/mysql/mysql-server/blob/beb865a960b9a8a16cf999c323e46c5b0c67f21f/plugin/semisync/semisync_source.cc#L844 and following), we can see that we do not have a 100% guarantee that the Source will be able to switch back.
Also in the code:
But, it is not that easy to detect that the replica has caught up. This is caused by the fact that MySQL’s replication protocol is asynchronous, meaning that if the source does not use the semi-sync protocol, the replica would not send anything to the source.
In all the run tests, the Source was not able to switch back. In short, Source was moving out from semi-sync and that was forever, no rollback. Keep in mind that while we go ahead.
What is the N I mentioned above? It represents the number of Replicas that must provide the acknowledgment back.
If you have a cluster of 10 nodes you may need to have only two of them involved in the semi-sync, no need to include them all. But if you have a cluster of three nodes where one is the Source, relying on one Replica only, it is not really secure. What I mean here is that if you choose to be semi-synchronous to ensure the data replicates, having it enabled for one single node is not enough, if that node crashes or whatever, you are doomed, as such you need at least two nodes with semi-sync.
Anyhow, the point is that if one of the Replica takes more than T to reply, the whole mechanism stops working, probably forever.
As we have seen above, to enable semi-sync on Source we manipulate the value of the GLOBAL variable rpl_semi_sync_source_enabled.
However, if I check the value of rpl_semi_sync_source_enabled when the Source shift to simple Asynchronous replication because of timeout:
select @@rpl_semi_sync_source_enabled;
select @@rpl_semi_sync_source_enabled;
+--------------------------------+
| @@rpl_semi_sync_source_enabled |
+--------------------------------+
|                              1 |
+--------------------------------+
As you can see the Global variable reports a value of 1, meaning that semi-sync is active also if not.
In the documentation, it is reported that to monitor the semi-sync activity we should check for Rpl_semi_sync_source_status. Which means that you can have Rpl_semi_sync_source_status = 0 and rpl_semi_sync_source_enabled =1 at the same time.
Is this a bug? Well according to documentation:
When the source switches between asynchronous or semisynchronous replication due to commit-blocking timeout or a replica catching up, it sets the value of the Rpl_semi_sync_source_status or Rpl_semi_sync_master_status status variable appropriately. Automatic fallback from semisynchronous to asynchronous replication on the source means that it is possible for the rpl_semi_sync_source_enabled or rpl_semi_sync_master_enabled system variable to have a value of 1 on the source side even when semisynchronous replication is in fact not operational at the moment. You can monitor the Rpl_semi_sync_source_status or Rpl_semi_sync_master_status status variable to determine whether the source currently is using asynchronous or semisynchronous replication.
It is not a bug. However, because you documented it, it doesn’t change the fact this is a weird/unfriendly/counterintuitive way of doing, which opens the door to many, many possible issues. Especially given you know the Source may fail to switch semi-synch back.
Just to close this part, we can summarize as follows:
- You activate semi-sync setting a global variable
- Server/Source can disable it (silently) without changing that variable
- The server will never restore semi-sync automatically
- The way to check if semi-sync works is to use the Status variable
- When Rpl_semi_sync_source_status = 0 and rpl_semi_sync_source_enabled =1 you had a Timeout and Source is now working in asynchronous replication
- The way to reactivate semi-sync is to set rpl_semi_sync_source_enabled to OFF first then rpl_semi_sync_source_enabled = ON.
- Replicas can be set with semi-sync ON/OFF but unless you do not STOP/START the Replica_IO_THREAD the state of the variable can be inconsistent with the state of the Server.
What can go wrong?
Semi-Synchronous is Not Seriously Affecting the Performance
Others had already discussed semi-sync performance in better detail. However, I want to add some color given the recent experience with our operator testing.
In the next graphs, I will show you the behavior of writes/reads using Asynchronous replication and the same load with Semi-synchronous.
For the record, the test was a simple Sysbench-tpcc test using 20 tables, 20 warehouses, and 256 threads for 600 seconds.
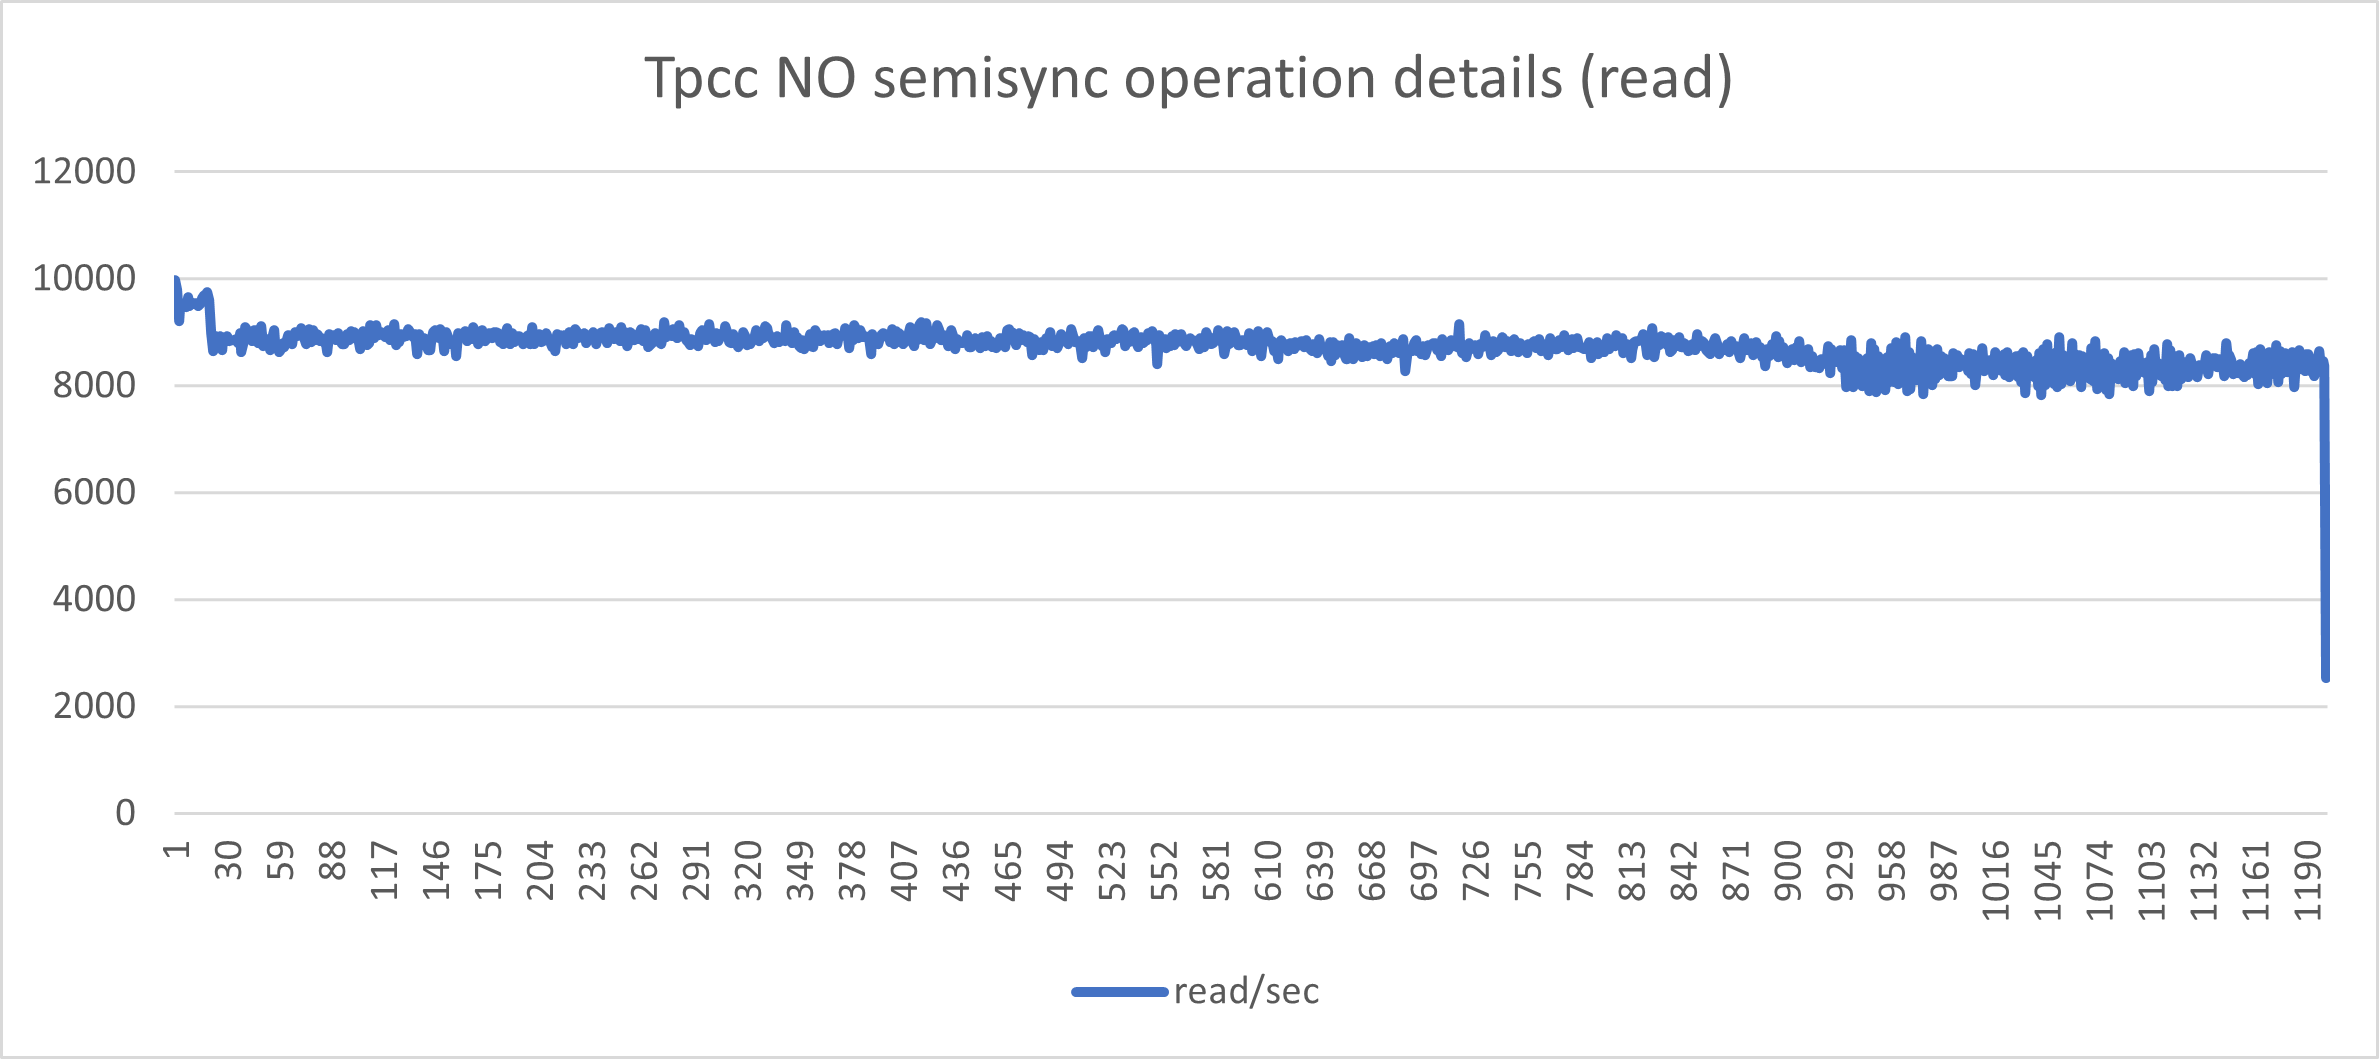
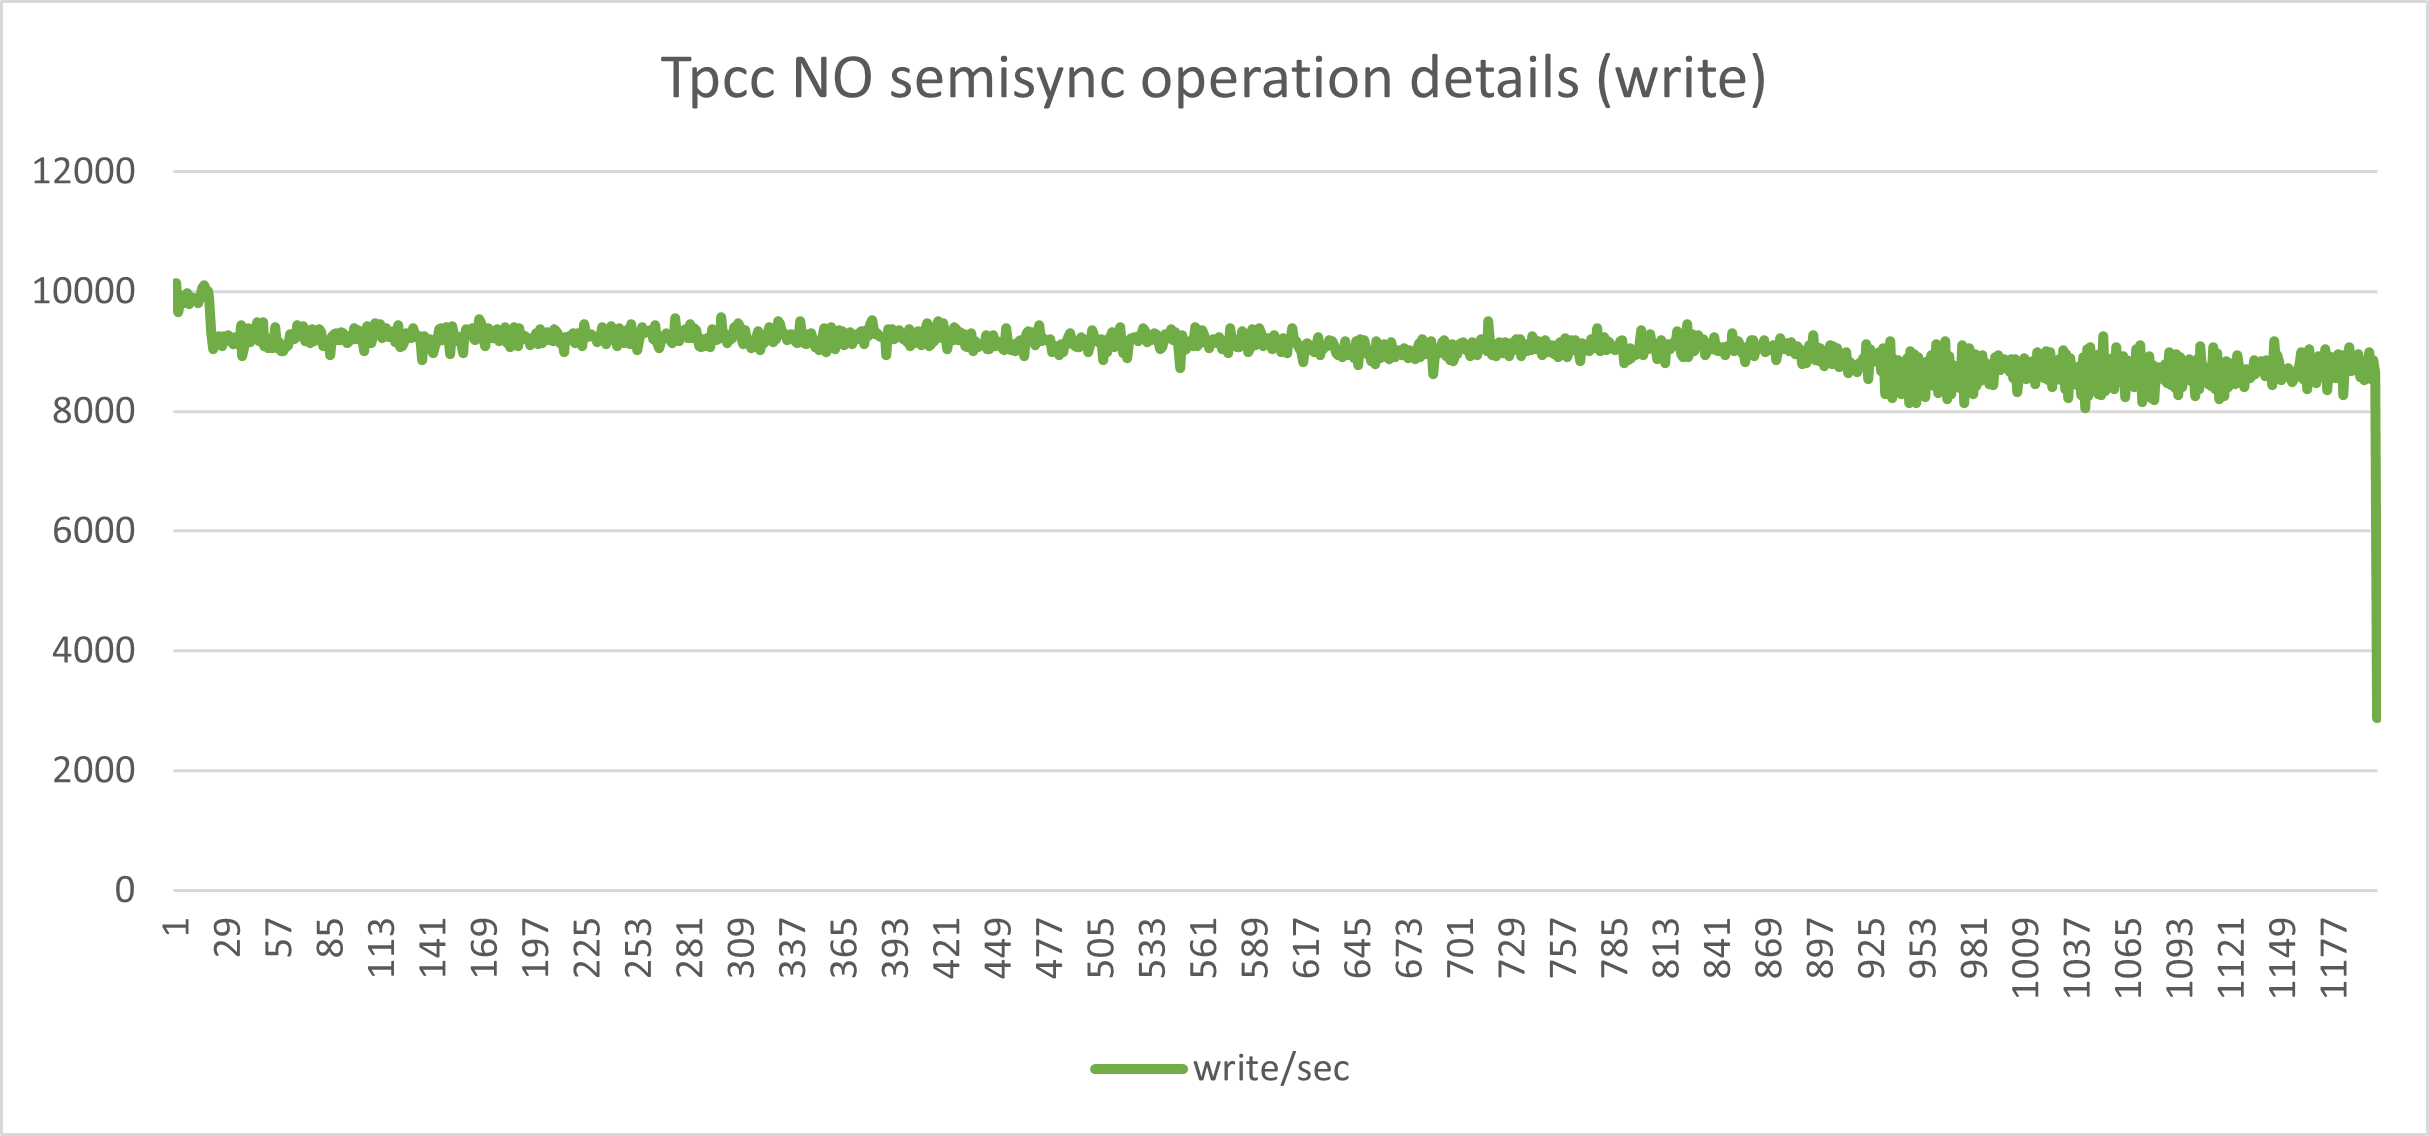
The one above indicates a nice and consistent set of load in r/w with minimal fluctuations. This is what we like to have.
The graphs below, represent the exact same load on the exact same environment but with semi-sync activated and no timeout.
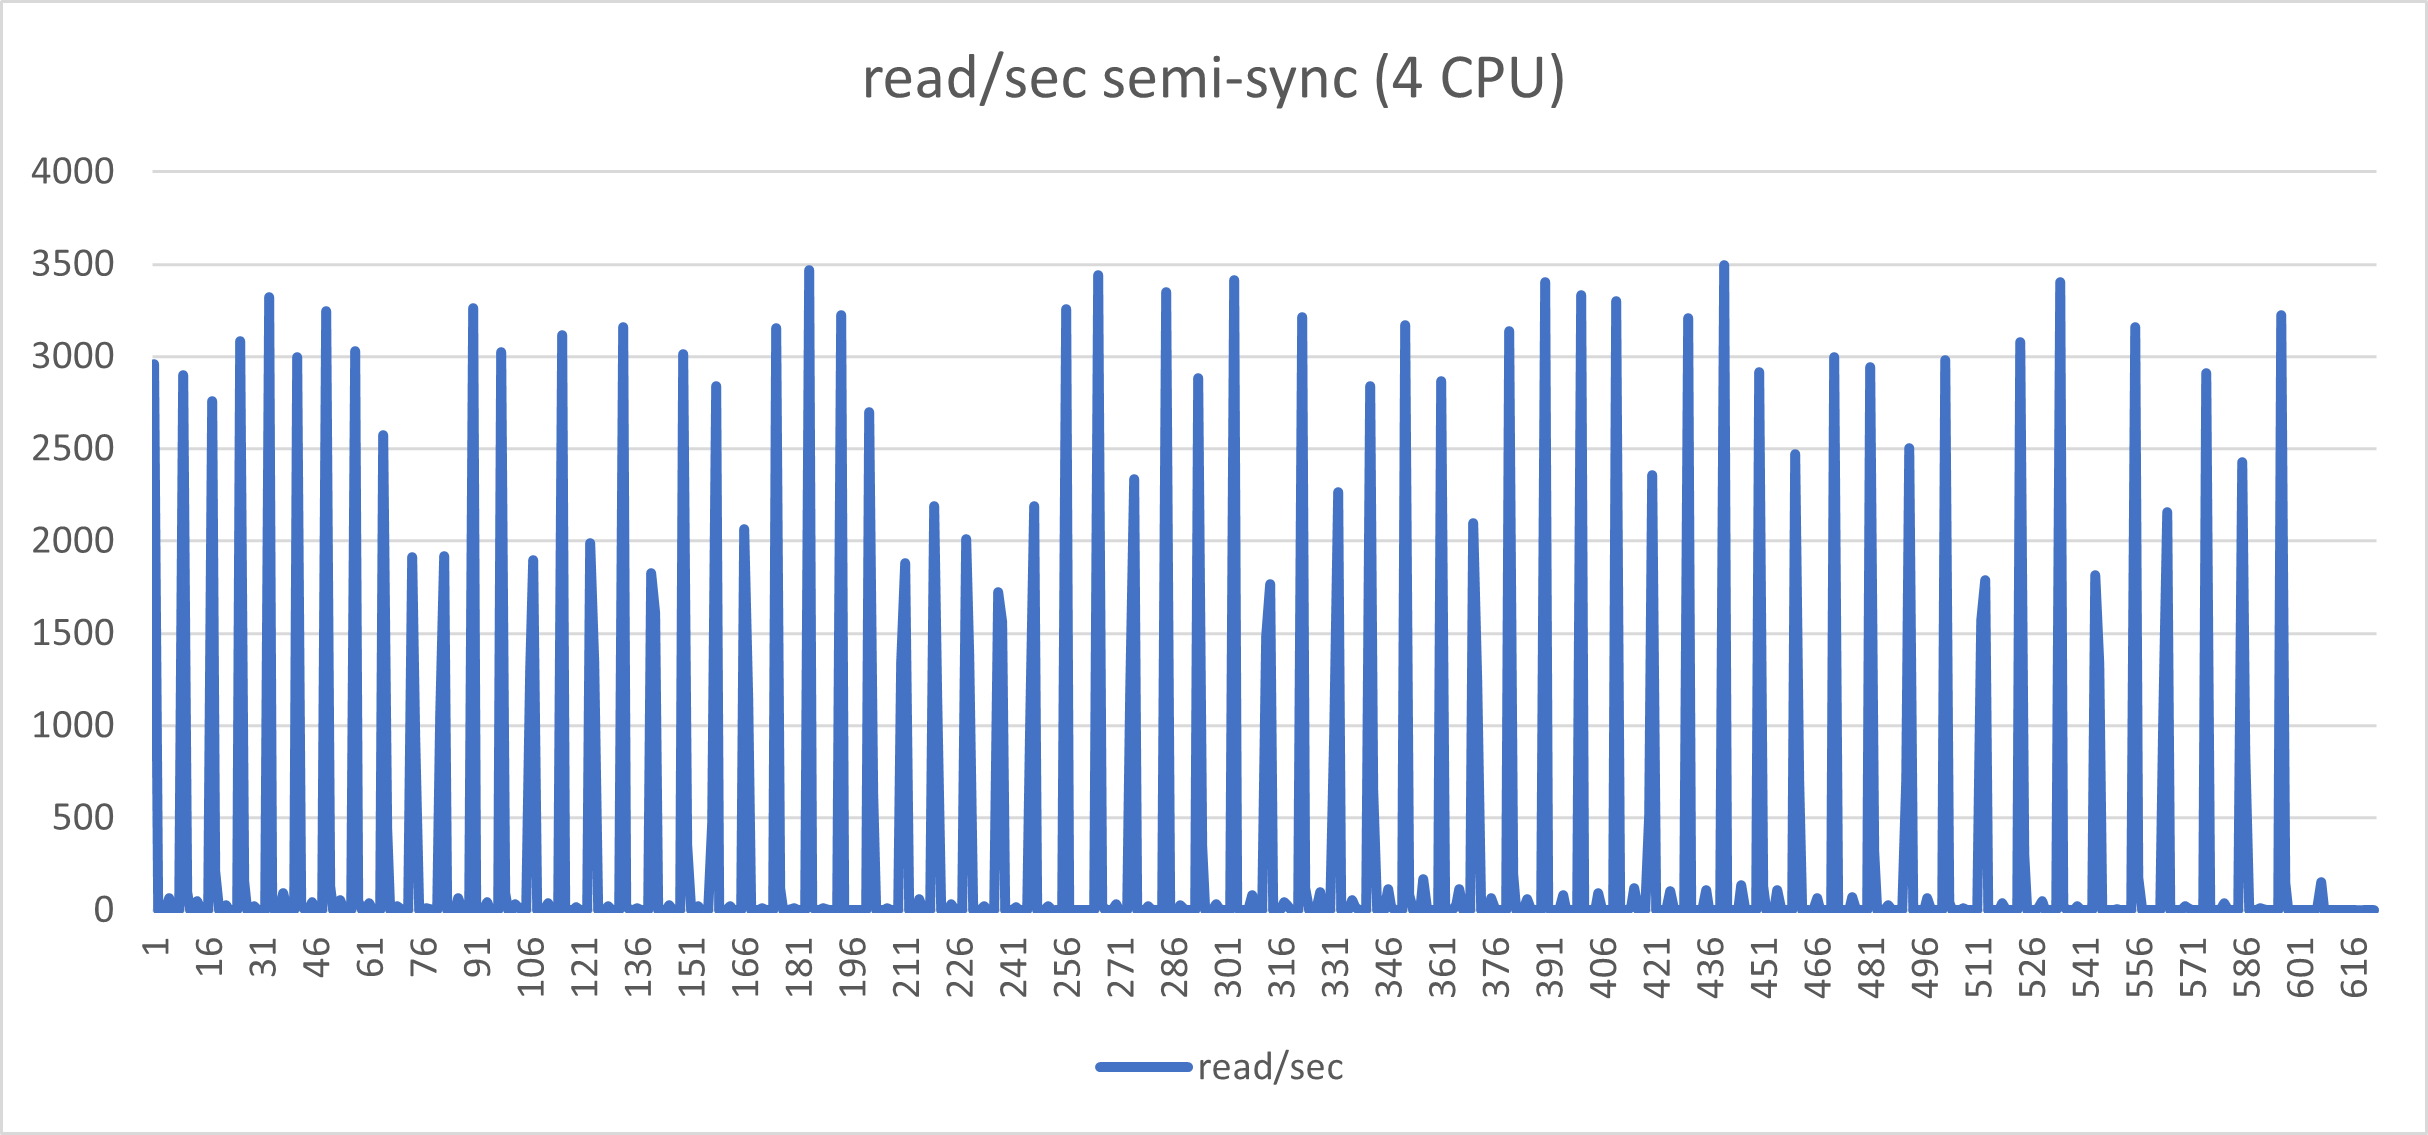
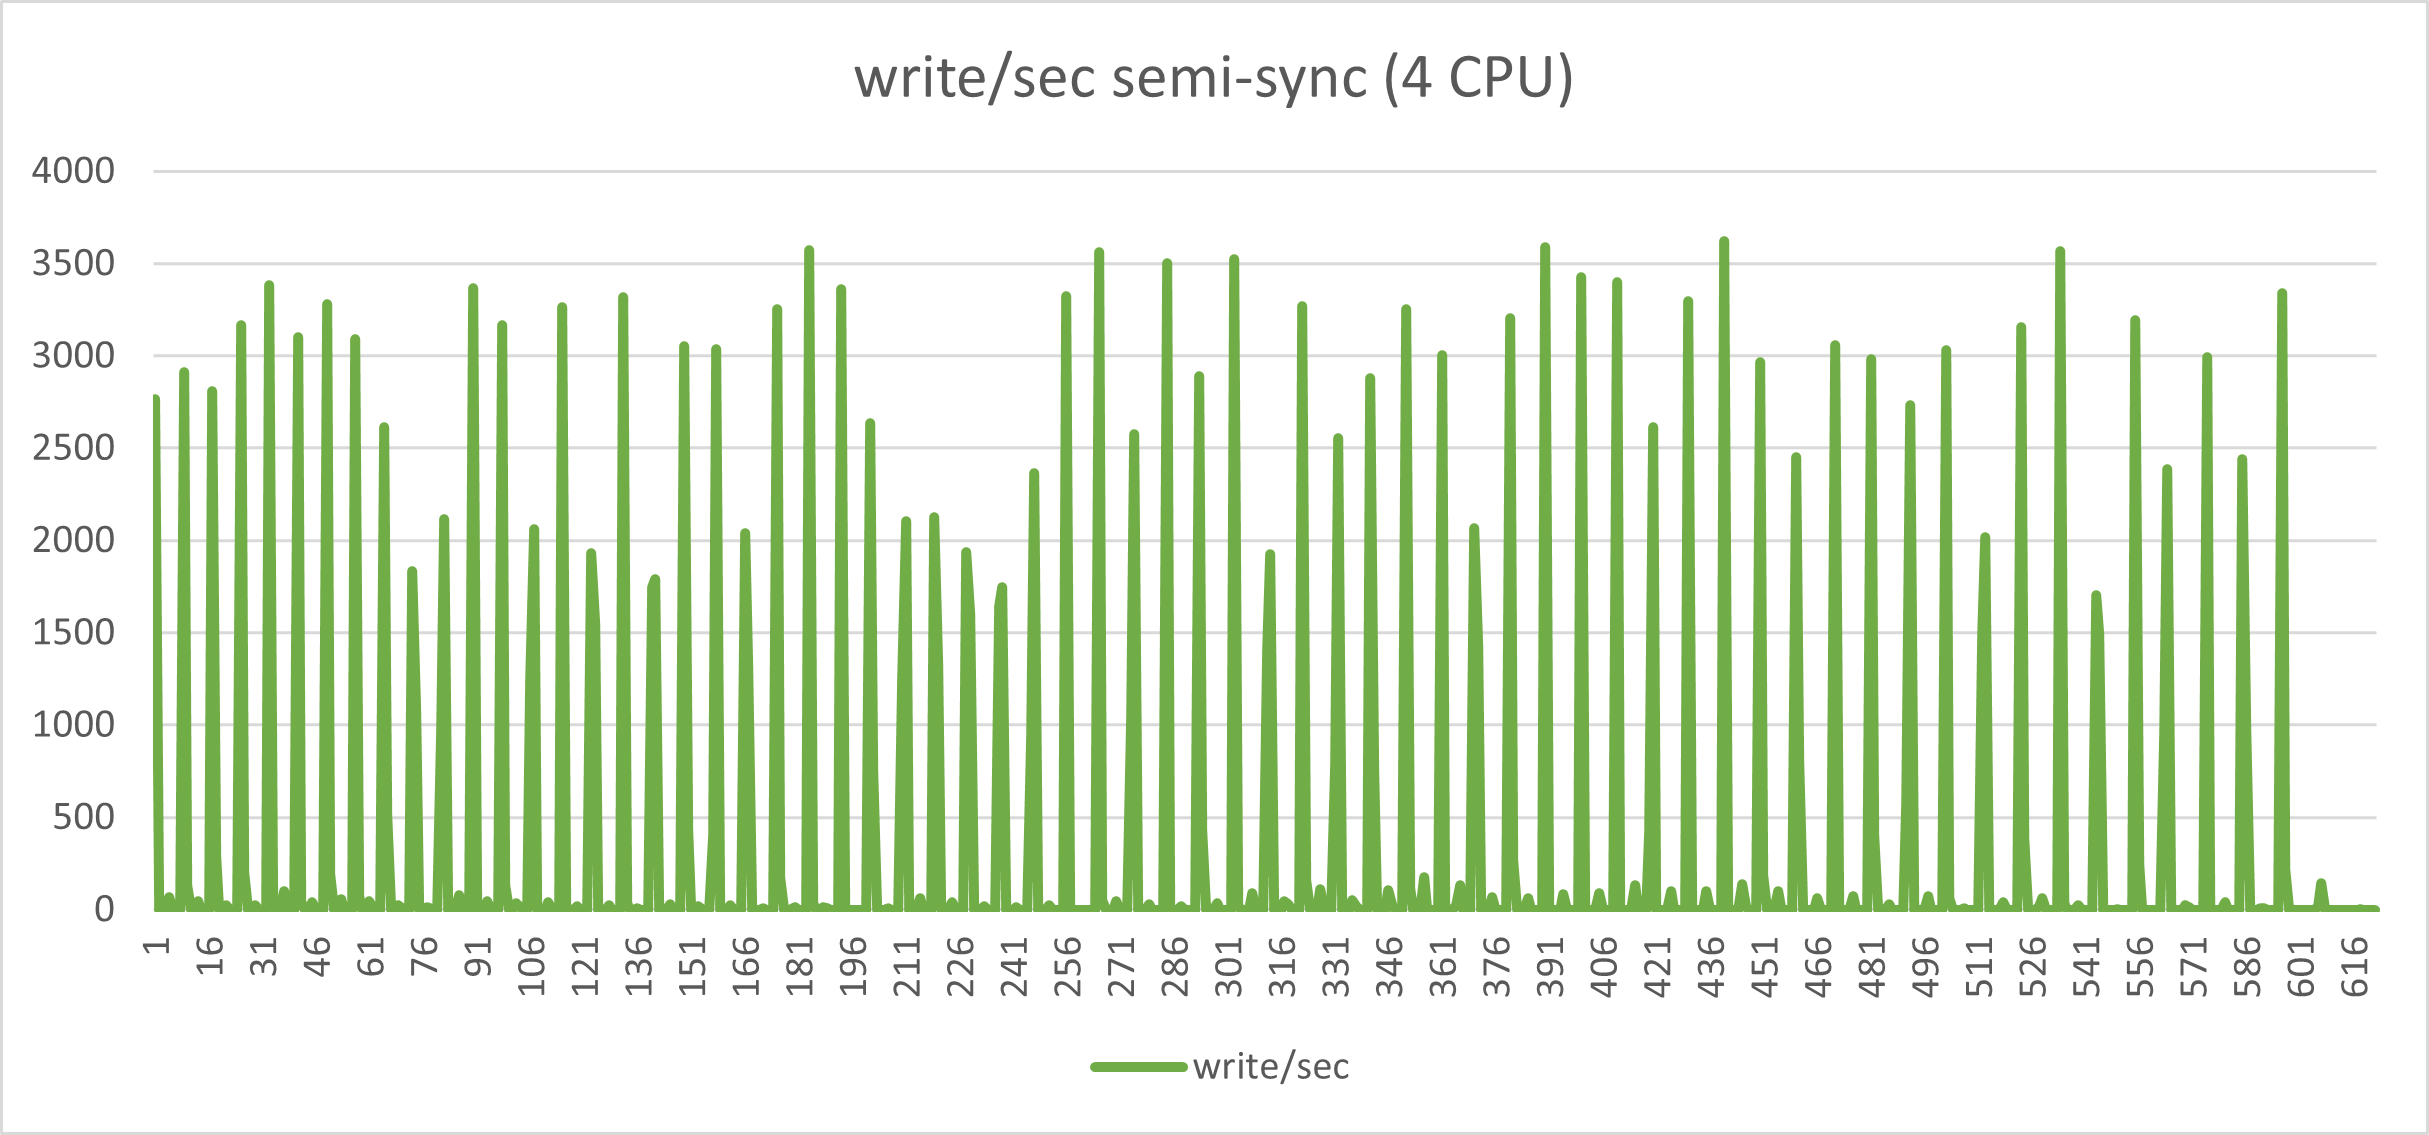
Aside from the performance loss (we went from Transaction 10k/s to 3k/s), the constant stop/go imposed by the semi-sync mechanism has a very bad effect on the application behavior when you have many concurrent threads and high loads. I challenge any serious production system to work in this way.
Of course, the results are in line with this yoyo game:
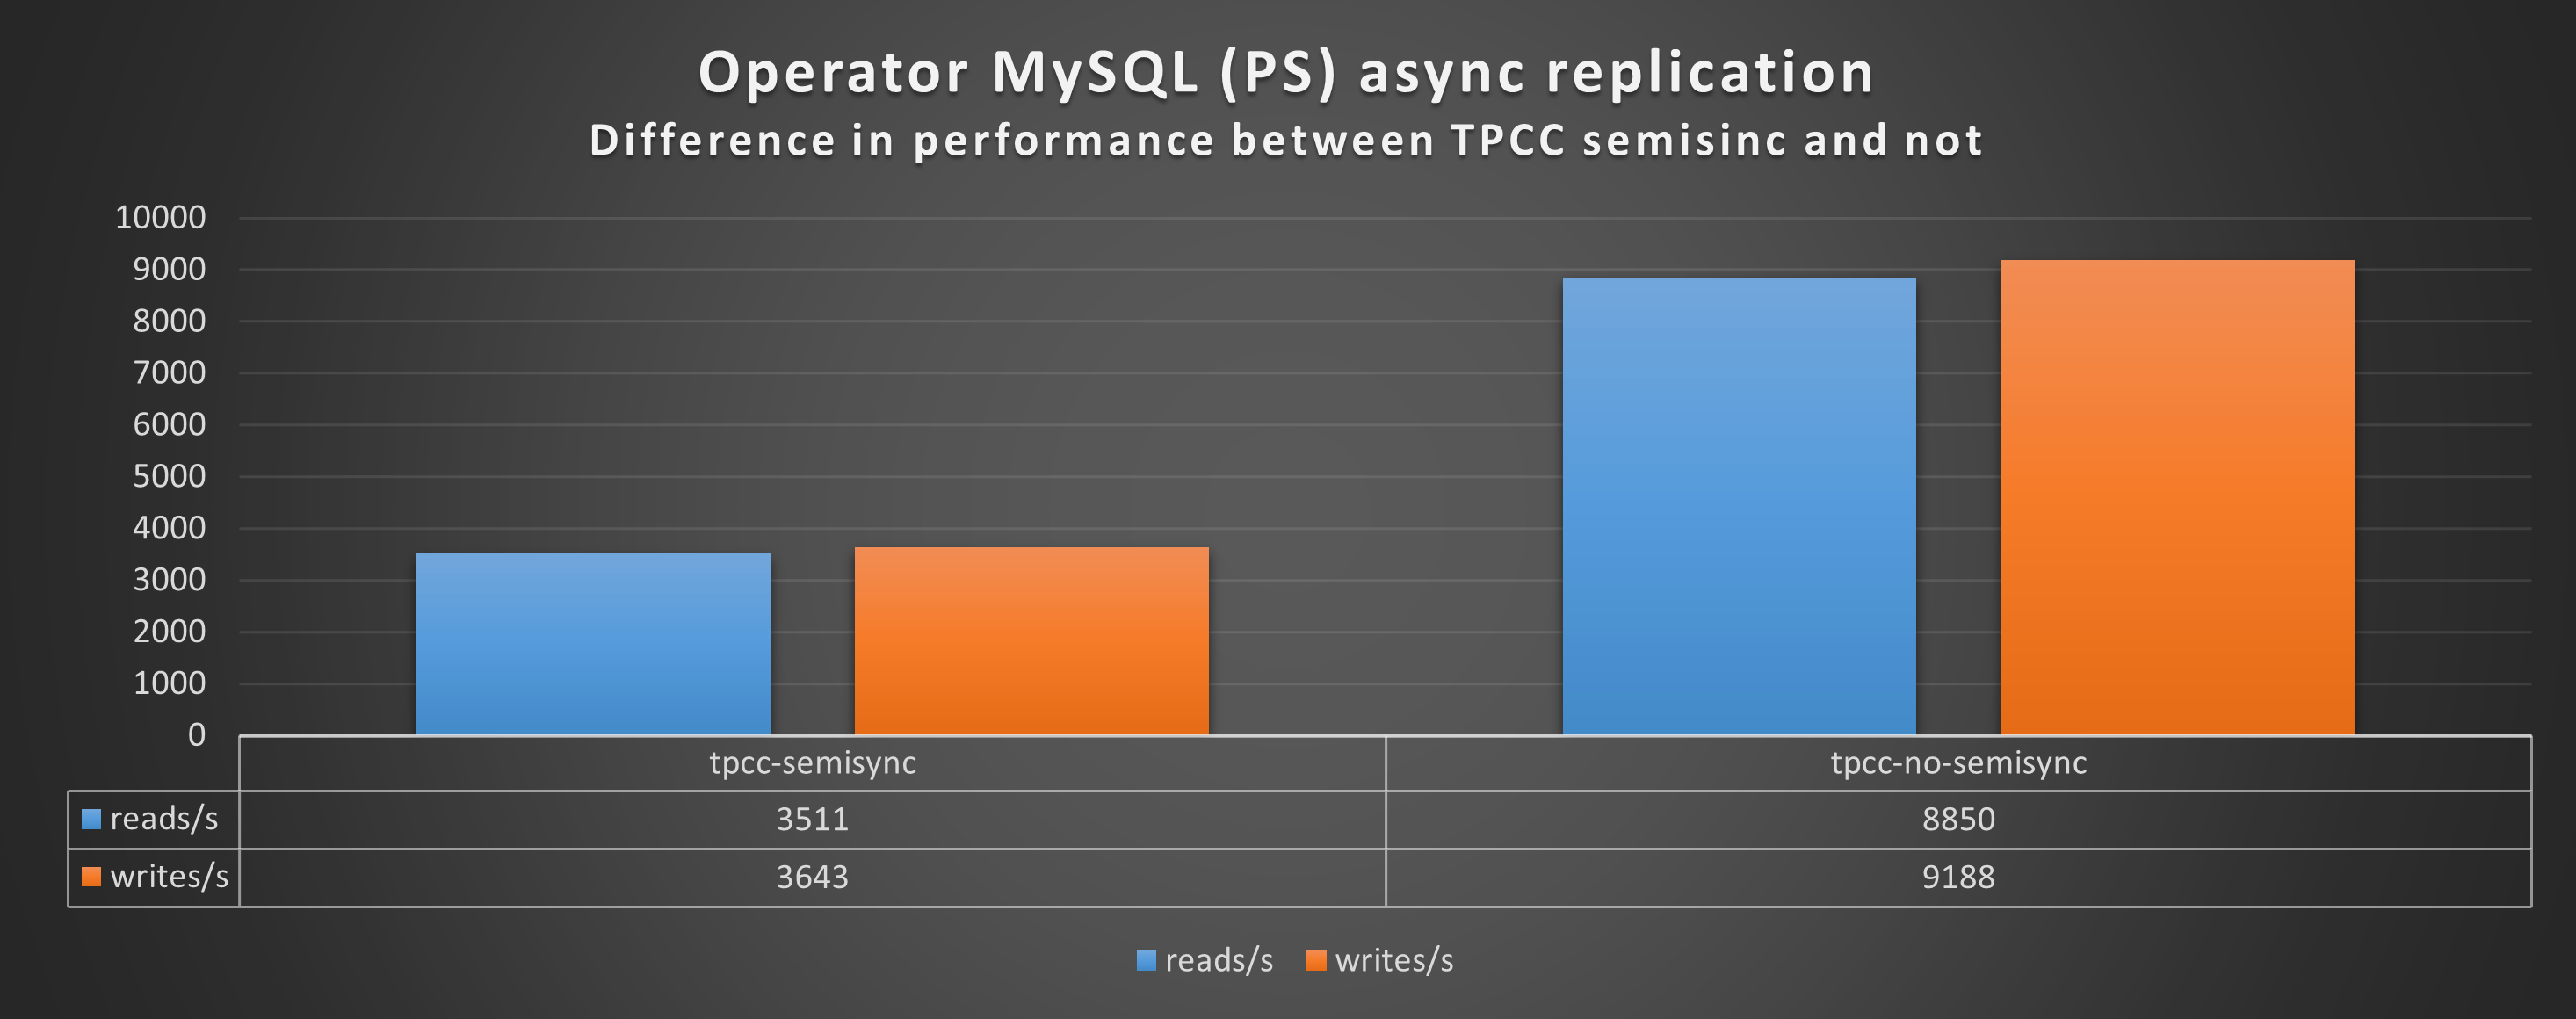
In the best case, when all was working as expected, and no crazy stuff happening, I had something around the 60% loss. I am not oriented to see this as a minor performance drop.
But at Least Your Data is Safe
As already stated at the beginning, the scope of semi-synchronous replication is to guarantee that the data in server A reaches server B before returning the OK to the application.
In short, given a period of one second, we should have minimal transactions in flight and limited transactions in the apply queue. While for standard replication (asynchronous), we may have … thousands.
In the graphs below we can see two lines:
- The yellow line represents the number of GTIDs “in-flight” from Source to destination, Y2 axes. In case of a Source crash, those transactions are lost and we will have data loss.
- The blue line represents the number of GTIDs already copied over from Source to Replica but not applied in the database Y1 axes. In case of a Source crash, we must wait for the Replica to process these entries, before making the node Write active, or we will have data inconsistency.
Asynchronous replication:
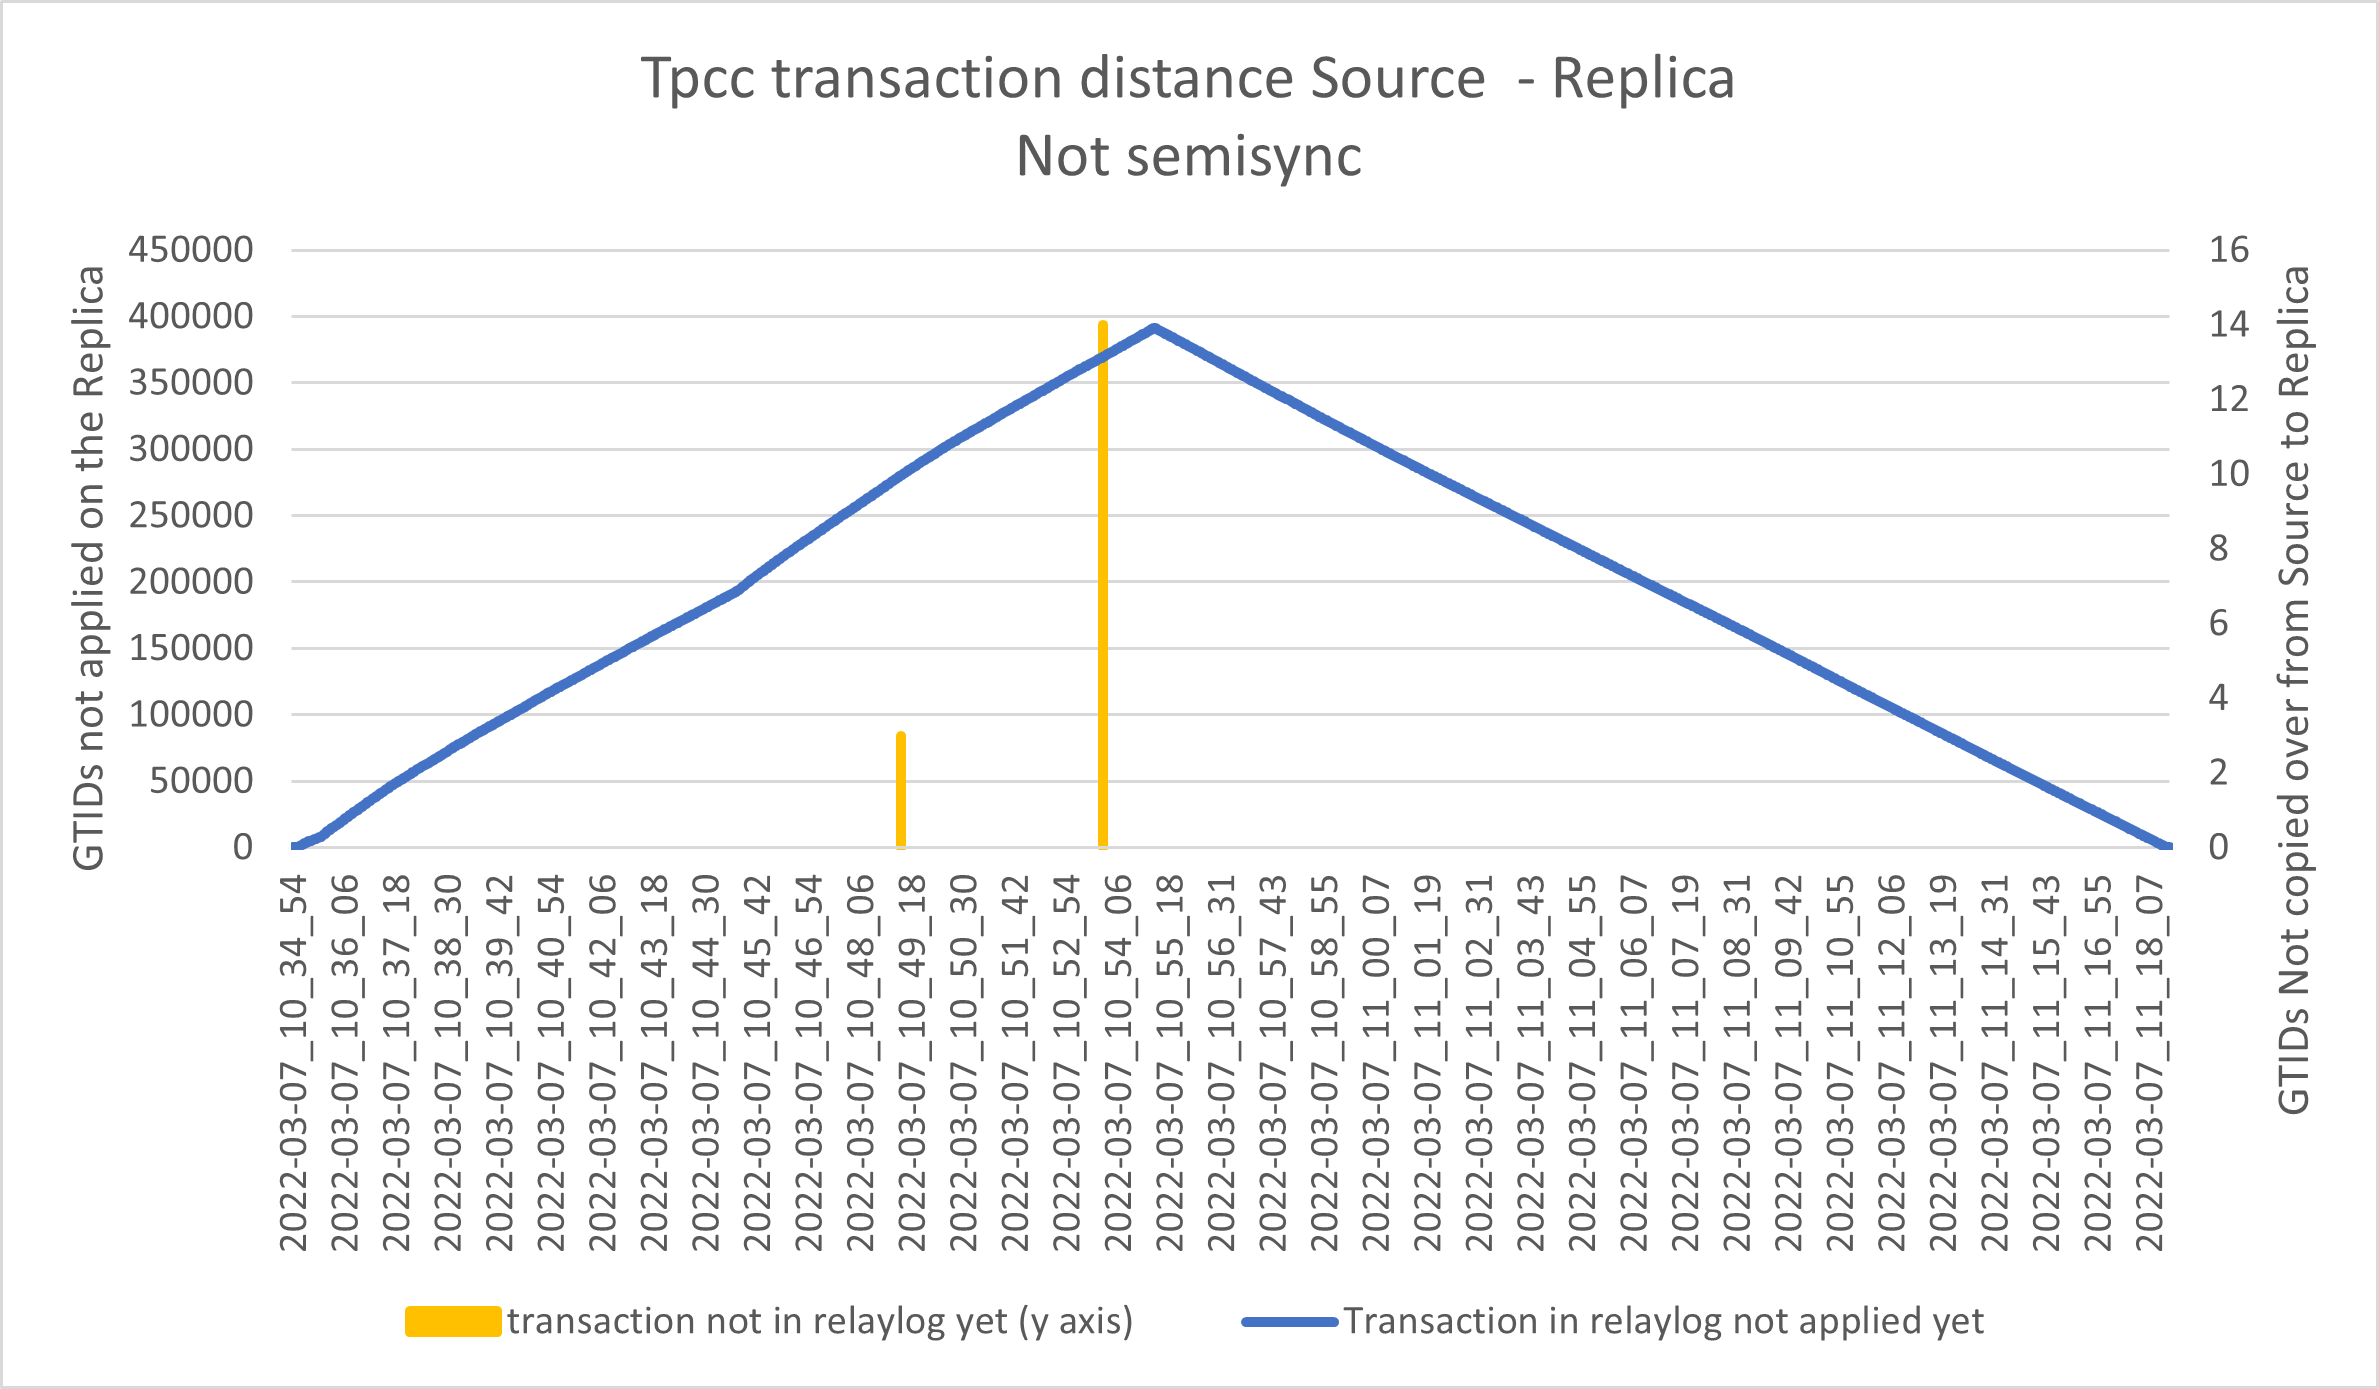
As expected we can see a huge queue in applying the transactions from relay-log, and some spike of transactions in flight.
Using semi-synchronous replication:
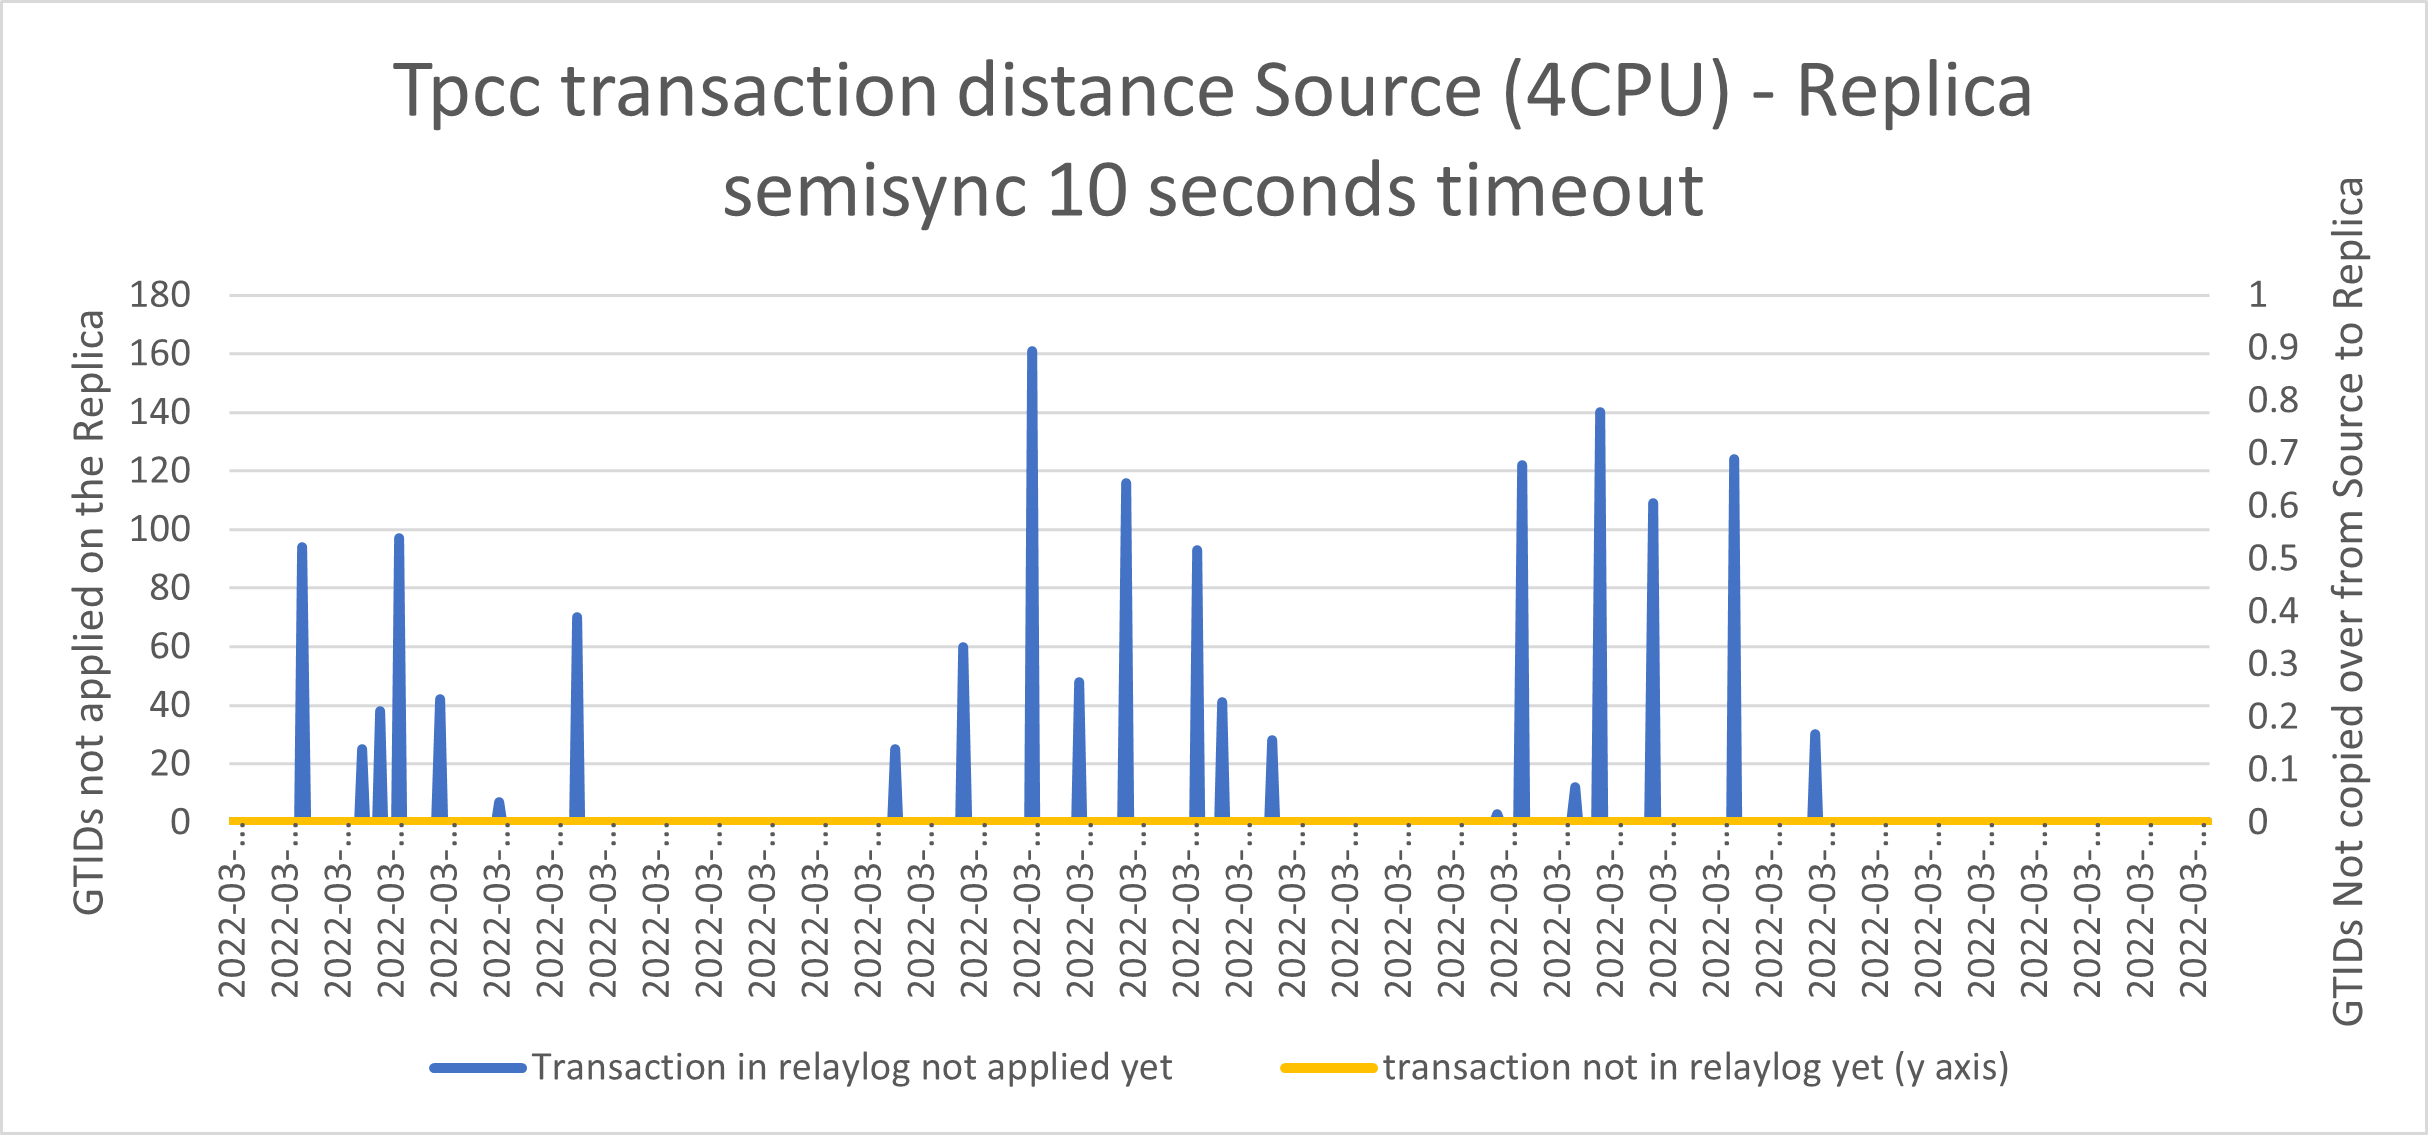
Yes, apparently we have reduced the queue and no spikes so no data loss.
But this happens when all goes as expected, and we know in production this is not the norm. What if we need to enforce the semi-sync but at the same time we cannot set the Timeout to ridiculous values like one week?
Simple, we need to have a check that puts back the semi-sync as soon as it is silently disabled (for any reason).
However doing this without waiting for the Replicas to cover the replication gap, cause the following interesting effects:
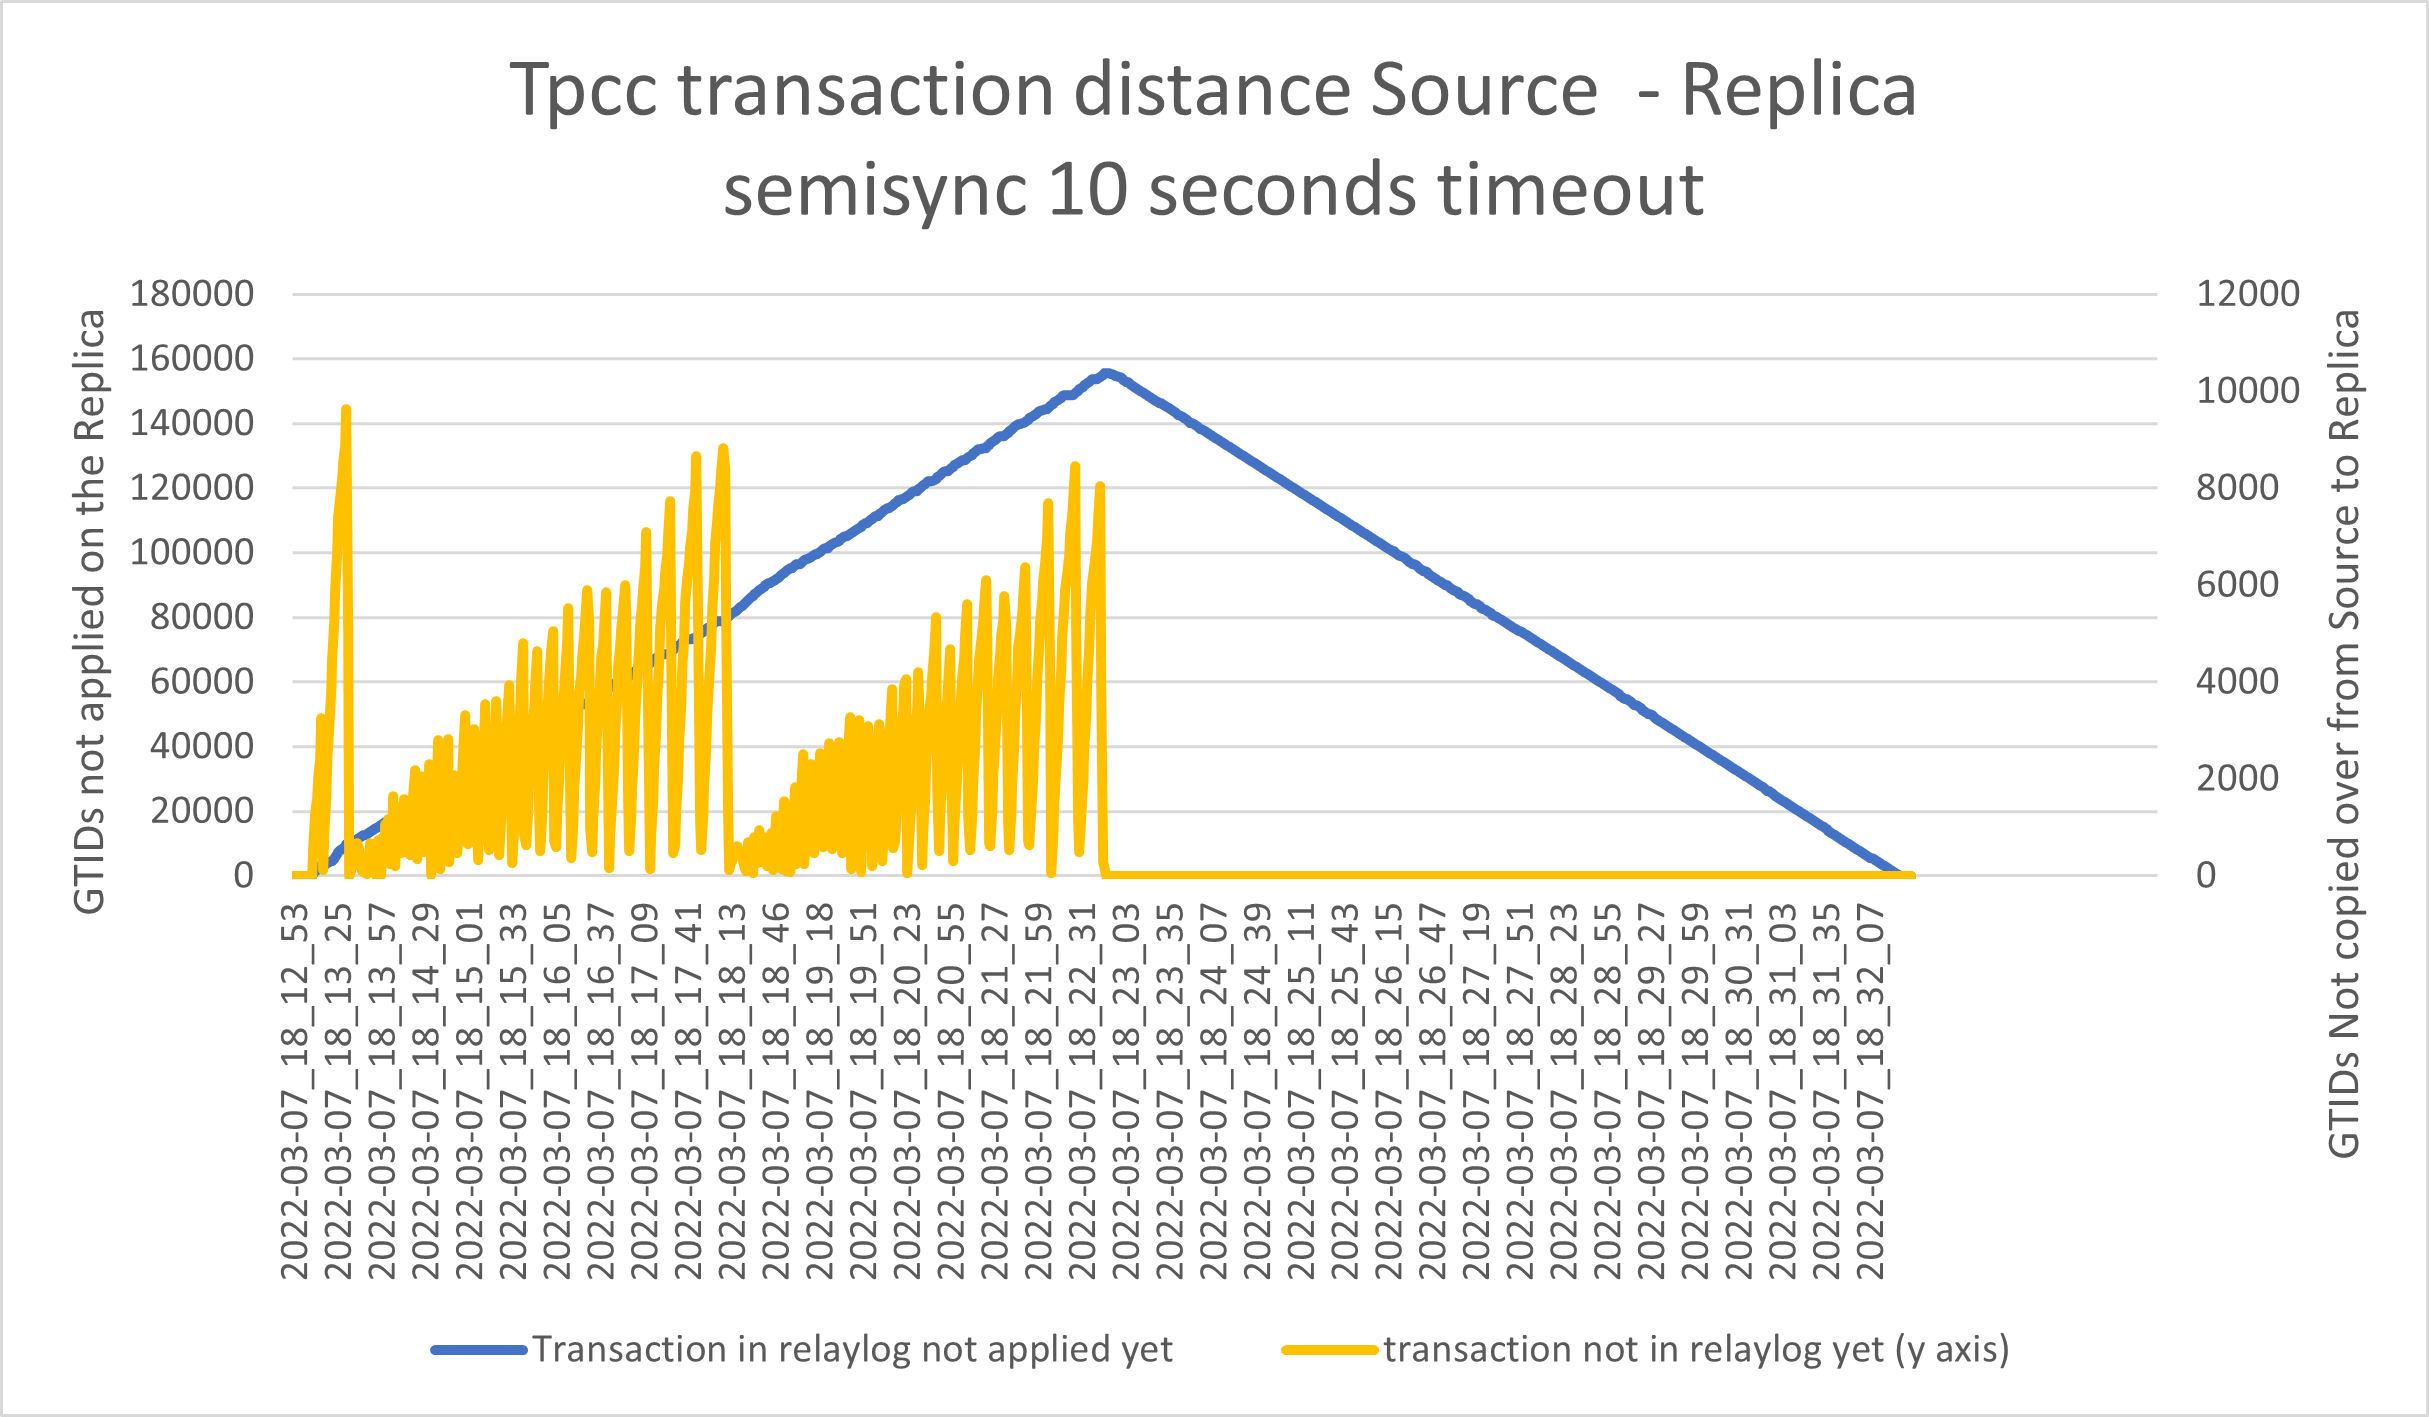
Thousands of transactions queued and shipped with the result of having a significant increase in the possible data loss and still a huge number of data to apply from the relay-log.
So the only possible alternative is to set the Timeout to a crazy value, however, this can cause a full production stop in the case a Replica hangs or for any reason, it disables the semi-sync locally.
Conclusion
First of all, I want to say that the tests on our operator using Asynchronous replication show a consistent behavior with the standard deployments in the cloud or premises. It has the same benefits, like better performance, and the same possible issues as a longer time to failover when it needs to wait for a Replica to apply the relay-log queue.
The semi-synchronous flag in the operator is disabled, and the tests I have done bring me to say “keep it like that!”. At least unless you know very well what you are doing and are able to deal with a semi-sync timeout of days.
I was happy to have the chance to perform these tests because they give me a way/time/need to investigate more on the semi-synchronous feature. Personally, I was not convinced about the semi-synchronous replication when it came out, and I am not now. I never saw a less consistent and less trustable feature in MySQL as semi-sync.
If you need to have a higher level of synchronicity in your database, just go for Group Replication, or Percona XtraDB Cluster, and stay away from semi-sync.
Otherwise, stay on Asynchronous replication, which is not perfect but it is predictable.
References
https://www.percona.com/blog/2012/01/19/how-does-semisynchronous-mysql-replication-work/
https://www.percona.com/blog/percona-monitoring-and-management-mysql-semi-sync-summary-dashboard/
https://datto.engineering/post/lossless-mysql-semi-sync-replication-and-automated-failover
https://planetscale.com/blog/mysql-semi-sync-replication-durability-consistency-and-split-brains
https://dev.mysql.com/doc/refman/8.0/en/replication-semisync-installation.html
https://dev.mysql.com/worklog/task/?id=1720
https://dev.mysql.com/worklog/task/?id=6630
Jan
11
2021
11
2021
--
Percona Kubernetes Operator for Percona XtraDB Cluster: HAProxy or ProxySQL?

 Percona Kubernetes Operator for Percona XtraDB Cluster comes with two different proxies, HAProxy and ProxySQL. While the initial version was based on ProxySQL, in time, Percona opted to set HAProxy as the default Proxy for the operator, without removing ProxySQL.
While one of the main points was to guarantee users to have a 1:1 compatibility with vanilla MySQL in the way the operator allows connections, there are also other factors that are involved in the decision to have two proxies. In this article, I will scratch the surface of this why.
Operator Assumptions
When working with the Percona Operator, there are few things to keep in mind:
- Each deployment has to be seen as a single MySQL service as if a single MySQL instance
- The technology used to provide the service may change in time
- Pod resiliency is not guaranteed, service resiliency is
- Resources to be allocated are not automatically calculated and must be identified at the moment of the deployment
- In production, you cannot set more than 5 or less than 3 nodes when using PXC
There are two very important points in the list above.
The first one is that what you get IS NOT a Percona XtraDB Cluster (PXC), but a MySQL service. The fact that Percona at the moment uses PXC to cover the service is purely accidental and we may decide to change it anytime.
The other point is that the service is resilient while the pod is not. In short, you should expect to see pods stopping to work and being re-created. What should NOT happen is that service goes down. Trying to debug each minor issue per node/pod is not what is expected when you use Kubernetes.
Given the above, review your expectations… and let us go ahead.
The Plus in the Game (Read Scaling)
As said, what is offered with Percona Operator is a MySQL service. Percona has added a proxy on top of the nodes/pods that help the service to respect the resiliency service expectations. There are two possible deployments:
- HAProxy
- ProxySQL
Both allow optimizing one aspect of the Operator, which is read scaling. In fact what we were thinking was, given we must use a (virtually synchronous) cluster, why not take advantage of that and allow reads to scale on the other nodes when available?
This approach will help all the ones using POM to have the standard MySQL service but with a plus.
But, with it also comes with some possible issues like READ/WRITE splitting and stale reads. See this article about stale reads on how to deal with it.
For R/W splitting we instead have a totally different approach in respect to what kind of proxy we implement.
If using HAProxy, we offer a second entry point that can be used for READ operation. That entrypoint will balance the load on all the nodes available.
Please note that at the moment there is nothing preventing an application to use the cluster1-haproxy-replicas also for write, but that is dangerous and wrong because will generate a lot of certification conflicts and BF abort, given it will distribute writes all over the cluster impacting on performance as well (and not giving you any write scaling). It is your responsibility to guarantee that only READS will go through that entrypoint.
If instead ProxySQL is in use, it is possible to implement automatic R/W splitting.
Global Difference and Comparison
At this point, it is useful to have a better understanding of the functional difference between the two proxies and what is the performance difference if any.
As we know HAProxy acts as a level 4 proxy when operating in TCP mode, it also is a forward-proxy, which means each TCP connection is established with the client with the final target and there is no interpretation of the data-flow.
ProxySQL on the other hand is a level 7 proxy and is a reverse-proxy, this means the client establishes a connection to the proxy who presents itself as the final backend. Data can be altered on the fly when it is in transit.
To be honest, it is more complicated than that but allows me the simplification.
On top of that, there are additional functionalities that are present in one (ProxySQL) and not in the other. The point is if they are relevant for use in this context or not. For a shortlist see below (source is from ProxySQL blog but data was removed) :

As you may have noticed HAProxy is lacking some of that functionalities, like R/W split, firewalling, and caching, proper of the level 7 implemented in ProxySQL.
The Test Environment
To test the performance impact I had used a cluster deployed in GKE, with these characteristics:
- 3 Main nodes n2-standard-8 (8 vCPUs, 32 GB memory)
- 1 App node n2-standard-8 (8 vCPUs, 32 GB memory)
- PXC pods using:
- 25GB of the 32 available
- 6 CPU of the 8 available
- HAProxy:
- 600m CPU
- 1GB RAM
- PMM agent
- 500m CPU
- 500 MB Ram
- Tests using sysbench as for (https://github.com/Tusamarco/sysbench), see in GitHub for command details.
What I have done is to run several tests running two Sysbench instances. One only executing reads, while the other reads and writes.
In the case of ProxySQL, I had R/W splitting thanks to the Query rules, so both sysbench instances were pointing to the same address. While testing HAProxy I was using two entry points:
- Cluster1-haproxy – for read and write
- Cluster1-haproxy-replicas – for read only
Then I also compare what happens if all requests hit one node only. For that, I execute one Sysbench in R/W mode against one entry point, and NO R/W split for ProxySQL.
Finally, sysbench tests were executed with the –reconnect option to force the tests to establish new connections.
As usual, tests were executed multiple times, on different days of the week and moments of the day. Data reported is a consolidation of that, and images from Percona Monitoring and Management (PMM) are samples coming from the execution that was closest to the average values.
Comparing Performance When Scaling Reads
These tests imply that one node is mainly serving writes while the others are serving reads. To not affect performance, and given I was not interested in maintaining full read consistency, the parameter wsrep_sync_wait was kept as default (0).
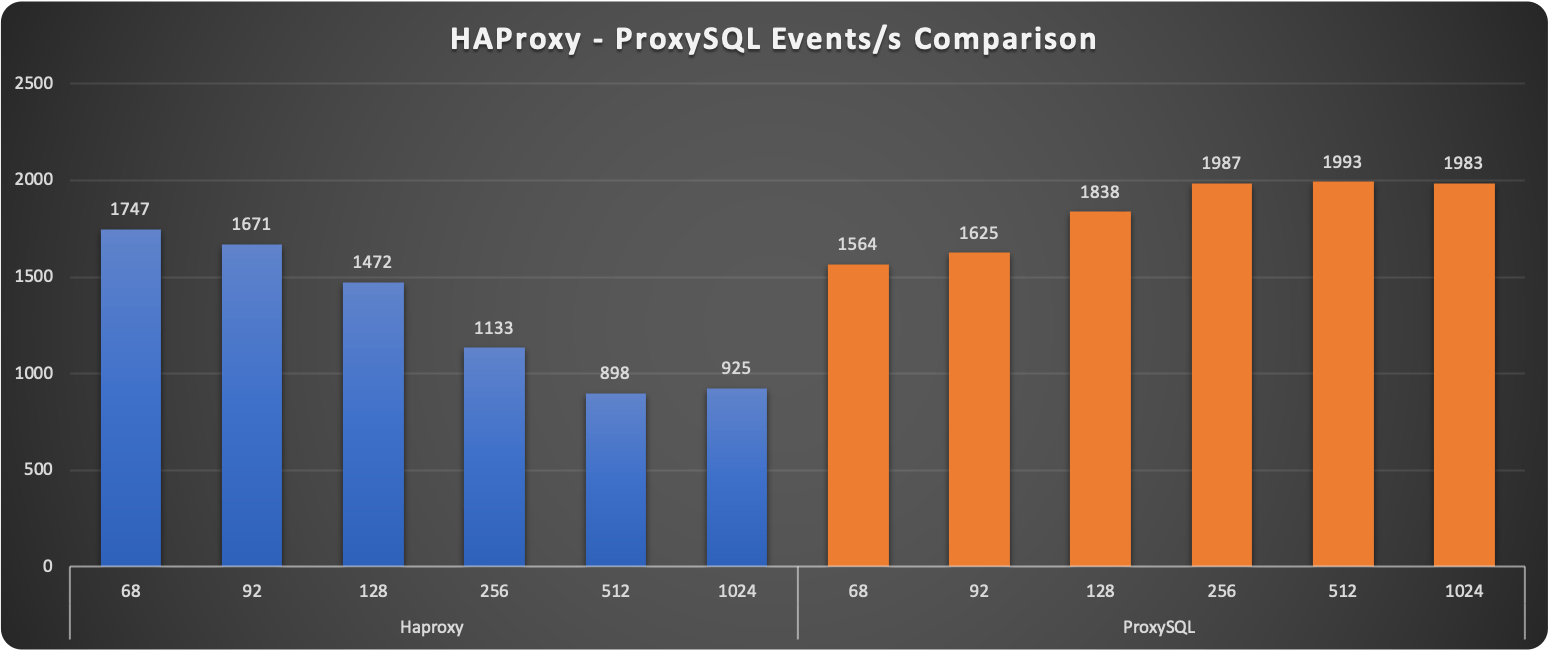
A first observation shows how ProxySQL seems to keep a more stable level of requests served. The increasing load penalizes HAProxy reducing if ? the number of operations at 1024 threads.
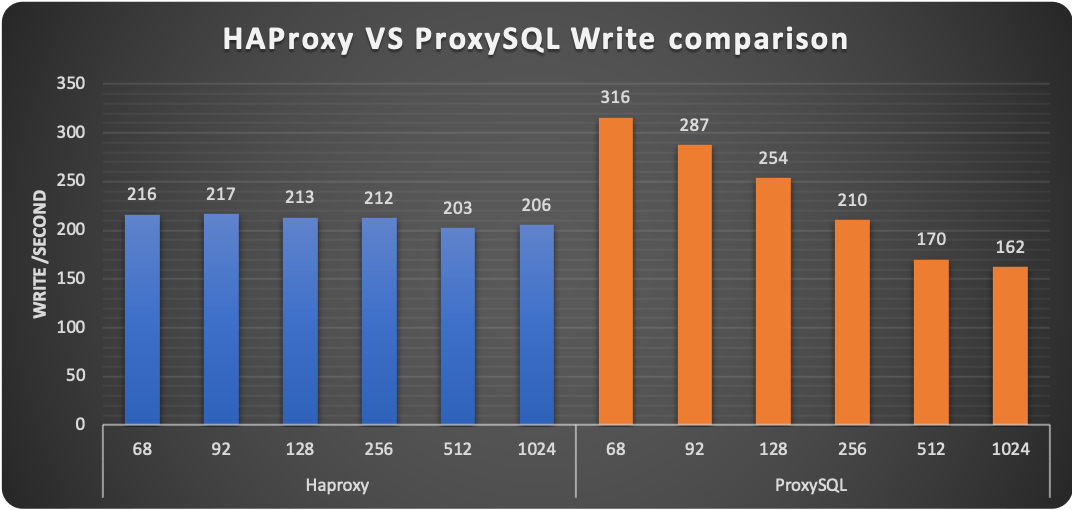

Digging a bit more we can see that HAProxy is performing much better than ProxySQL for the WRITE operation. The number of writes remains almost steady with minimal fluctuations. ProxySQL on the other hand is performing great when the load in write is low, then performance drops by 50%.
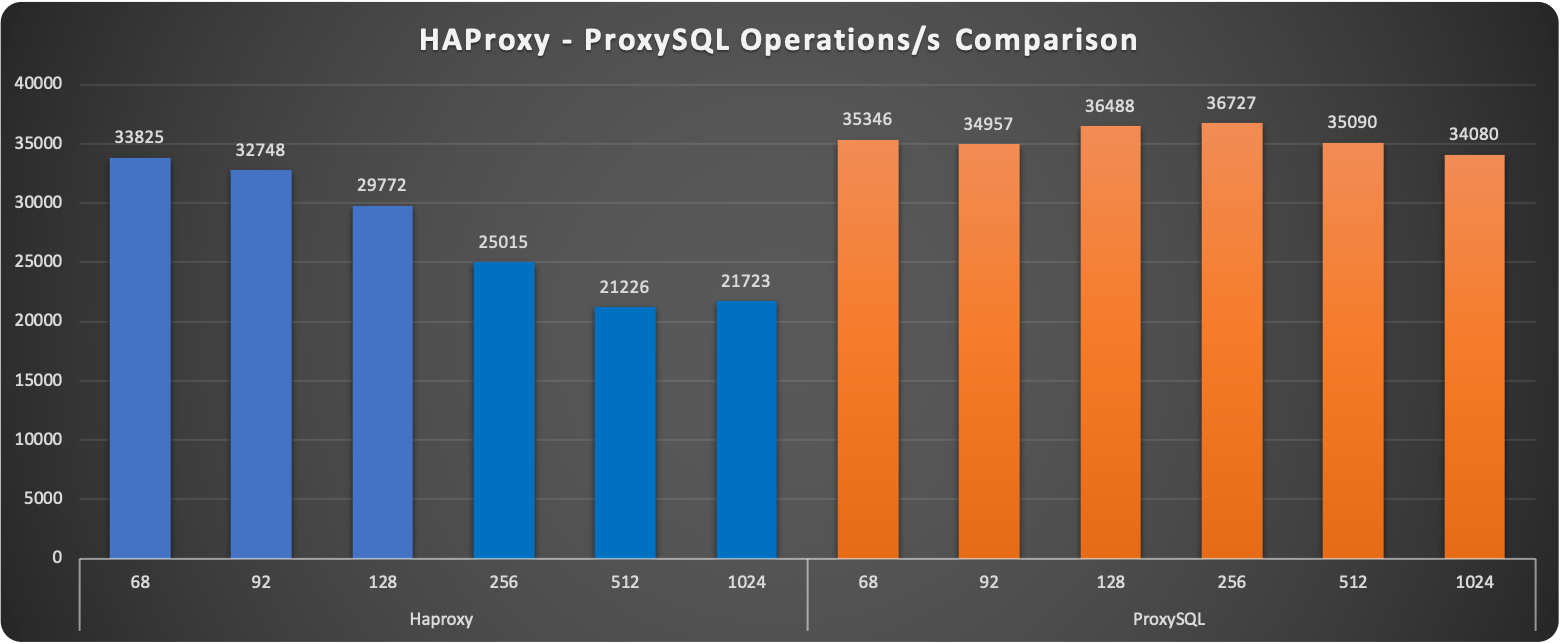
For reads, we have the opposite. ProxySQL is able to scale in a very efficient way, distributing the load across the nodes and able to maintain the level of service despite the load increase.
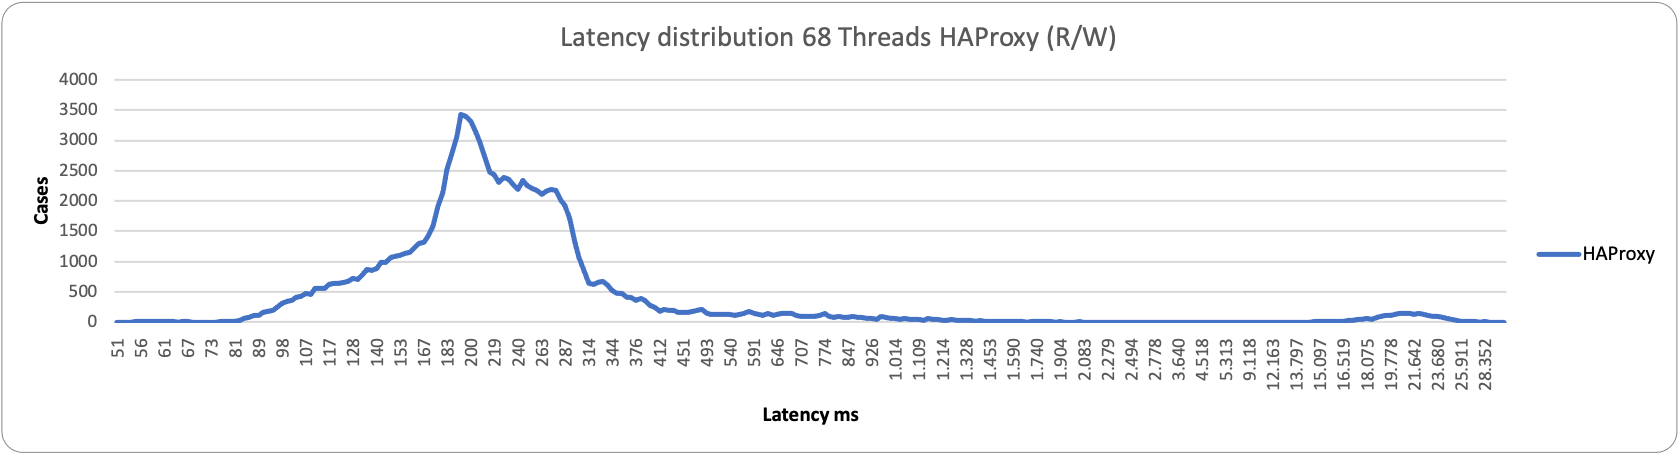
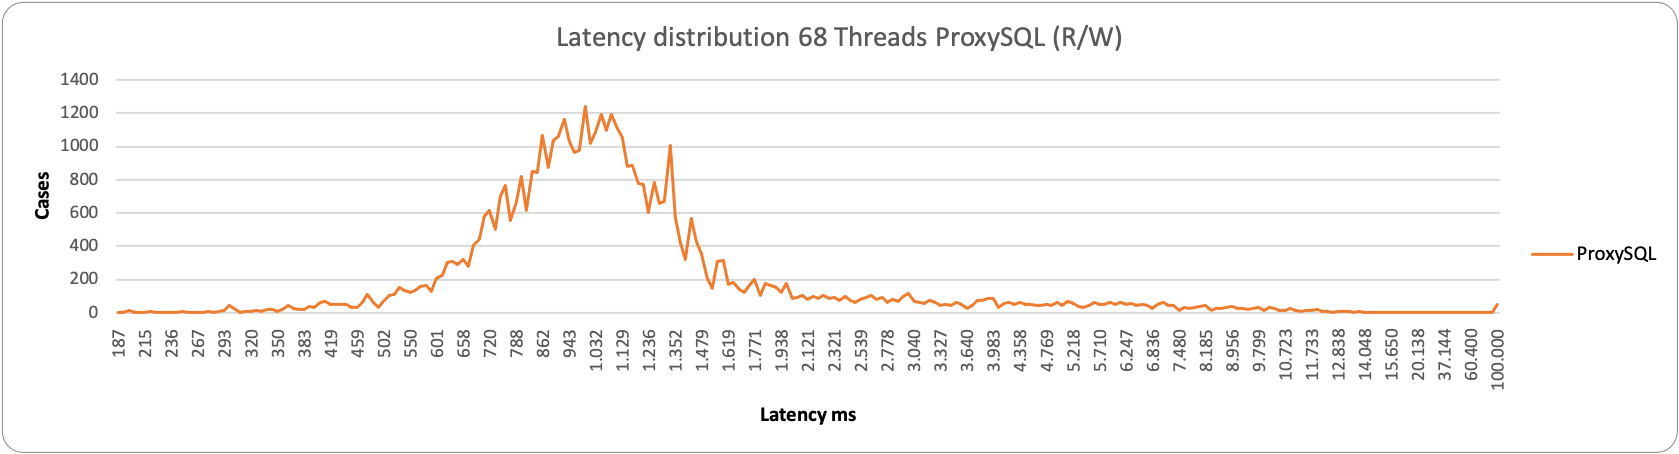
If we start to take a look at the latency distribution statistics (sysbench histogram information), we can see that:
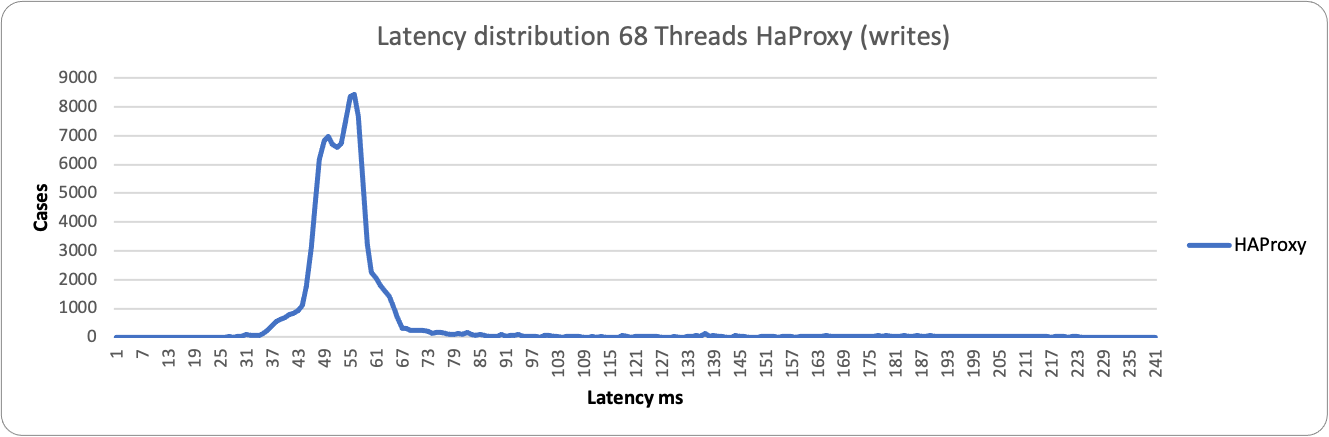
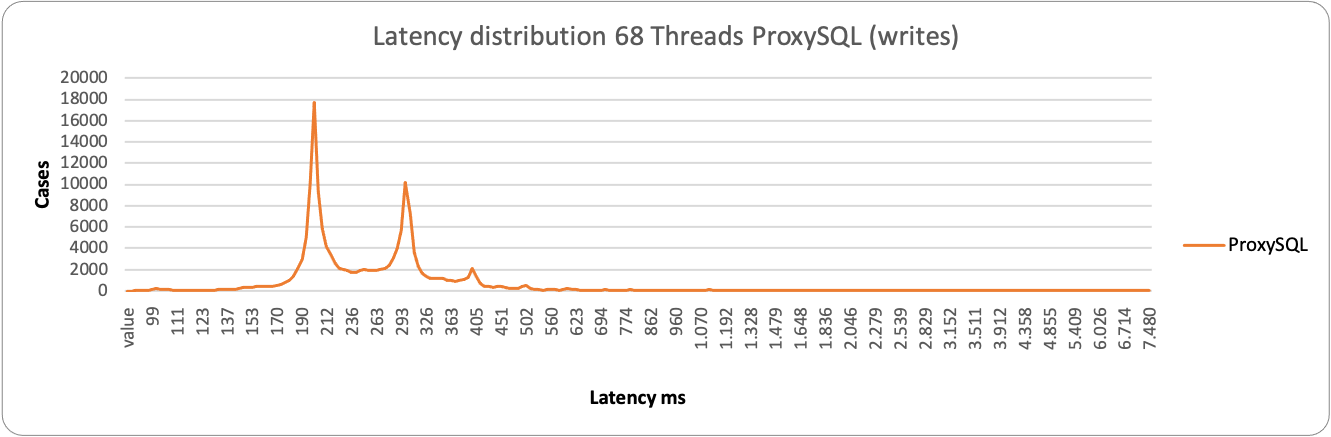
In the case of low load and writes, both proxies stay on the left side of the graph with a low value in ms. HAProxy is a bit more consistent and grouped around 55ms value, while ProxySQL is a bit more sparse and spans between 190-293ms.
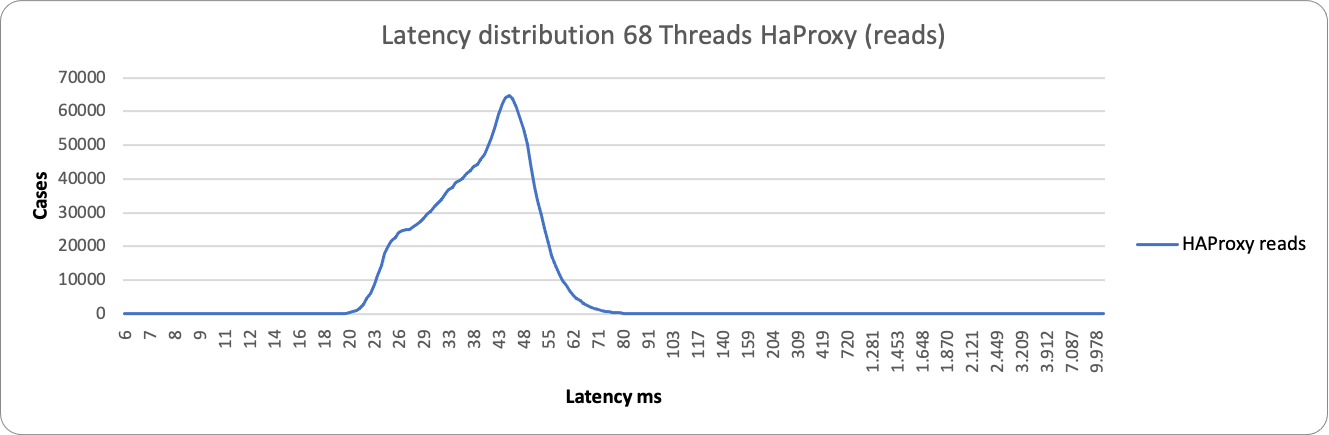
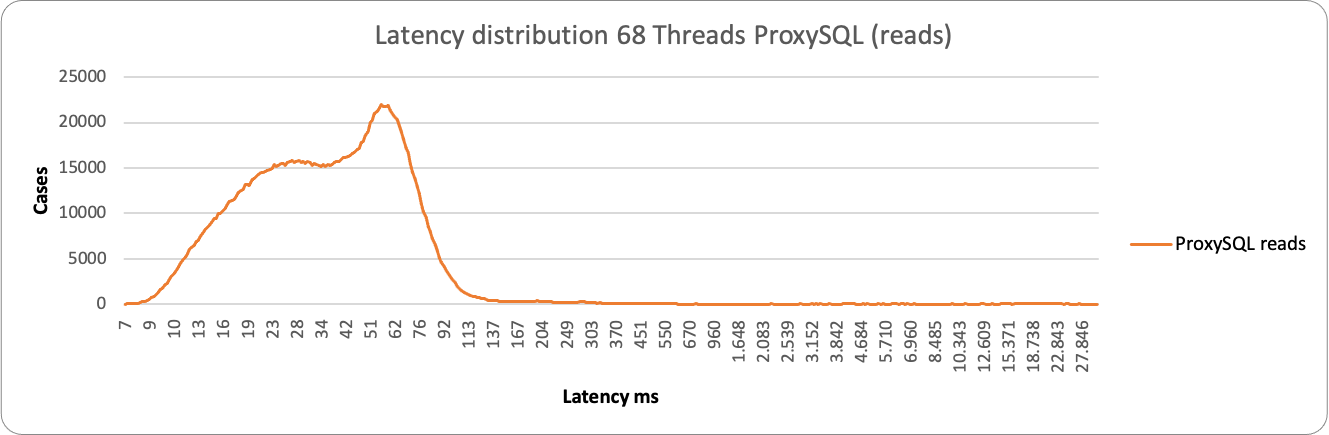
About reads we have similar behavior, both for the large majority between 28-70ms. We have a different picture when the load increases:
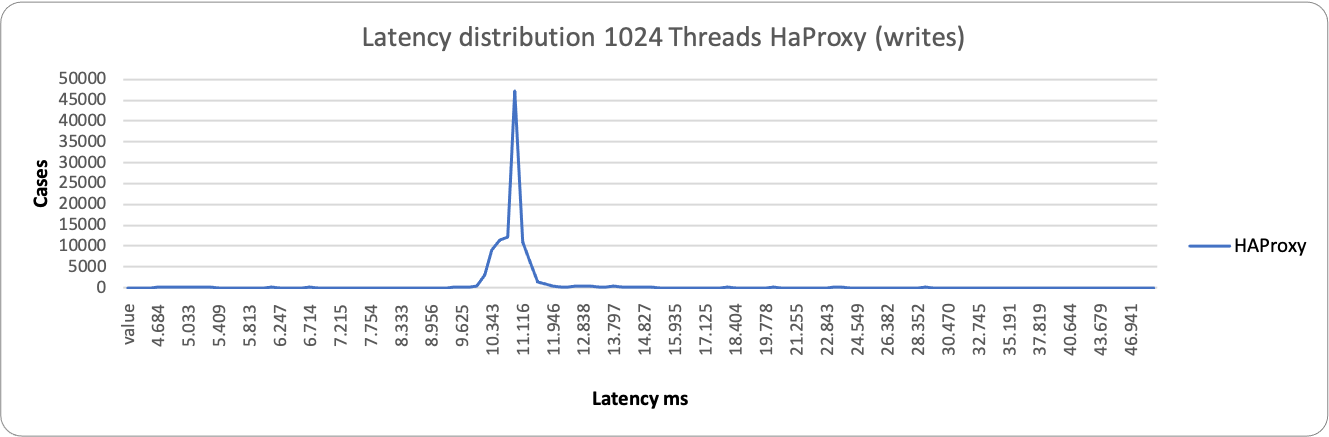
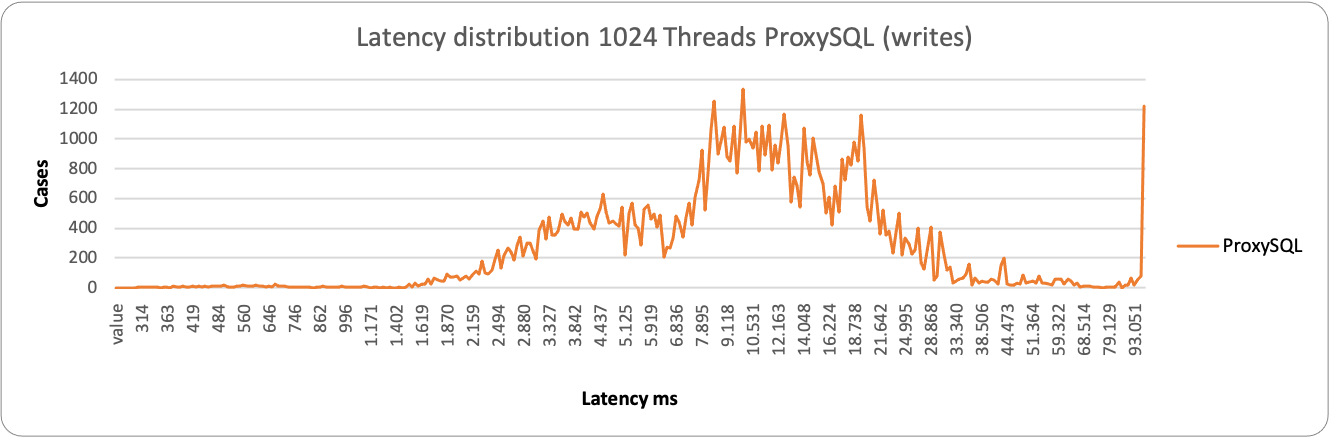
ProxySQL is having some occurrences where it performs better, but it spans in a very large range, from ~2k ms to ~29k ms. While HAProxy is substantially grouped around 10-11K ms. As a result, in this context, HAProxy is able to better serve writes under heavy load than ProxySQL.
Again, a different picture in case of reads.
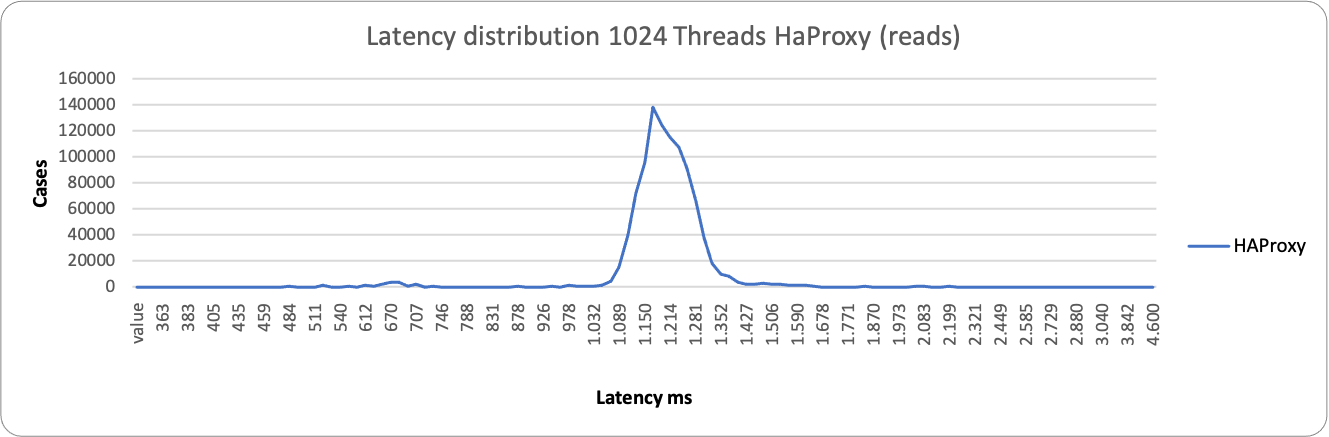
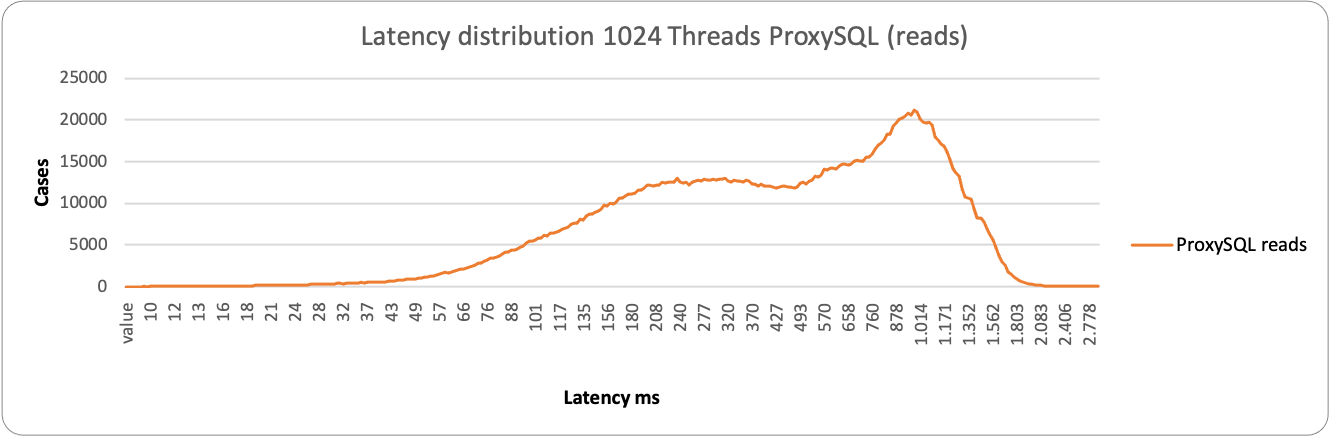
Here ProxySQL is still spanning on a wide range ~76ms – 1500ms, while HAProxy is more consistent but less efficient, grouping around 1200ms the majority of the service. This is consistent with the performance loss we have seen in READ when using high load and HAProxy.
Comparing When Using Only One Node
But let us now discover what happens when using only one node. So using the service as it should be, without the possible Plus of read scaling.
The first thing I want to mention is strange behavior that was consistently happening (no matter what proxy used) at 128 threads. I am investigating it but I do not have a good answer yet on why the Operator was having that significant drop in performance ONLY with 128 threads.
Aside from that, the results were consistently showing HAProxy performing better in serving read/writes. Keep in mind that HAProxy just establishes the connection point-to-point and is not doing anything else. While ProxySQL is designed to eventually act on the incoming stream of data.
This becomes even more evident when reviewing the latency distribution. In this case, no matter what load we have, HAProxy performs better:
As you can notice, HAProxy is less grouped than when we have two entry points, but it is still able to serve more efficiently than ProxySQL.
Conclusions
As usual, my advice is to use the right tool for the job, and do not force yourself into something stupid. And as clearly stated at the beginning, Percona Kubernetes Operator for Percona XtraDB Cluster is designed to provide a MySQL SERVICE, not a PXC cluster, and all the configuration and utilization should converge on that.
ProxySQL can help you IF you want to scale a bit more on READS using the possible plus. But this is not guaranteed to work as it works when using standard PXC. Not only do you need to have a very good understanding of Kubernetes and ProxySQL if you want to avoid issues, but with HAProxy you can scale reads as well, but you need to be sure you have R/W separation at the application level.
In any case, utilizing HAProxy for the service is the easier way to go. This is one of the reasons why Percona decided to shift to HAProxy. It is the solution that offers the proxy service more in line with the aim of the Kubernetes service concept. It is also the solution that remains closer to how a simple MySQL service should behave.
You need to set your expectations correctly to avoid being in trouble later.
References
Percona Kubernetes Operator for Percona XtraDB Cluster
Wondering How to Run Percona XtraDB Cluster on Kubernetes? Try Our Operator!