Jul
23
2019
--

Connect to MySQL after hitting ERROR 1040: Too many connections

ERROR 1040

ERROR 1040: Too many connectionsERROR 1040…again

A pretty common topic in Support tickets is the rather infamous error: ERROR 1040: Too many connections. The issue is pretty self-explanatory: your application/users are trying to create more connections than the server allows, or in other words, the current number of connections exceeds the value of the max_connections variable.

This situation on its own is already a problem for your end-users, but when on top of that you are not able to access the server to diagnose and correct the root cause, then you have a really big problem; most times you will need to terminate the instance and restart it to recover.

Root user can’t connect either! Why!?

In a properly set up environment, a user with SUPER privilege will be able to access the instance and diagnose the error 1040 problem that is causing connection starvation, as explained in the manual:

mysqld actually permits max_connections + 1 client connections. The extra connection is reserved for use by accounts that have the SUPER privilege. By granting the privilege to administrators and not to normal users (who should not need it), an administrator who also has the PROCESS privilege can connect to the server and use SHOW PROCESSLIST to diagnose problems even if the maximum number of unprivileged clients are connected.

But we see lots of people who give SUPER privileges to their application or script users, either due to application requirements (dangerous!) or due to lack of knowledge regarding the consequences, but the case is then that the reserved connection is taken by a regular user, and your administrative user (usually root) won’t be able to connect.

How to guarantee access to the instance

Besides resorting to the well known GDB hack devised by Aurimas long ago for Error 1040, there are now better solutions, but you need to enable them first.

With Percona Server 5.5.29 and up, and with MySQL 8.0.14 and up, you can set up an extra port that allows a number of extra connections. These additional interfaces will not be used by your applications; they are only for your database administrators and monitoring/health-check agents (see note on this further below).

Setting up in Percona Server

Starting with Percona Server 5.5.29, you can simply add extra_port to your my.cnf and the next time you restart the port will become available and will listen on the same bind_address as regular connections. If you don’t set the extra_port variable, no additional port will be available by default.

You can also define extra_max_connections which sets the number of connections this port will handle. The default value for this is 1.

For a quick demo, I have saturated connections on the regular users port of an instance where I already have set extra_port and extra_max_connections in the my.cnf:

~ egrep 'port|extra' my.sandbox.cnf
port                  = 45989
extra_port            = 45999
extra_max_connections = 10

# attempt to show some variables
~ mysql --host=127.0.0.1 --port=45989 --user=msandbox --password -e "SHOW GLOBAL VARIABLES WHERE Variable_name IN ('port', 'extra_port')"
ERROR 1040 (HY000): Too many connections

# now again, through the extra_port
~ mysql --host=127.0.0.1 --port=45999 --user=msandbox --password -e "SHOW GLOBAL VARIABLES WHERE Variable_name IN ('port', 'extra_port')"
+---------------+-------+
| Variable_name | Value |
+---------------+-------+
| extra_port    | 45999 |
| port          | 45989 |
+---------------+-------+

Note that extra_port has been removed in Percona Server 8.0.14 and newer since MySQL Community has implemented admin_port which duplicates this functionality. So make sure to edit your my.cnf when upgrading to Percona Server 8.0.14 or newer if you already have extra_port defined there!

Setting up in MySQL Community

As mentioned, this requires MySQL 8.0.14 where WorkLog 12138 was implemented.

To enable the Admin Interface you have to define the admin_addres, which must be a single and unique (no wildcards allowed) IPv4, IPv6, IPv4-mapped, or hostname on which the admin interface will listen. If this variable is not defined, then the interface is not enabled at all.

You can also define a port, but it’s not mandatory and it defaults to 33062. So if that port is free then you don’t need to configure it. When defined, both variables should be placed under the [mysqld] section of your my.cnf.

Finally, you can also set create_admin_listener_thread (disabled by default) which will create a separate thread for incoming connection handling, which can be helpful in some situations.

Another difference is that Oracle’s documentation claims that:

There is no limit on the number of administrative connections.

(This is in contrast with our default of 1). I am not sure what this means, but I would be careful making sure you don’t accidentally establish 1,000,000 connections as they might not be limited but would still consume resources!

Using it for monitoring and health-checks

A very useful thing is that not only humans can use the extra interface/port during emergency cases where max_connections has been reached; it can also be used by your monitoring system and your proxy/load balancer/service discovery health-check probes.

Monitoring scripts can still pull data for your graphs to later understand why the connection pile up happened. And your health-check scripts could report the degraded state of the server, possibly with a particular code indicating connections are saturated but the server is responsive (meaning it could clear on its own, so it might be worth allowing a longer timeout to failover).

As a warning: make sure to establish only one single connection at a time for monitoring/health probes, to avoid filling up the extra_max_connections in Percona Server or to avoid creating one million threads in MySQL. In other words, your scripts should not connect again if the previous query/connection to the database is still ongoing.

And here is the same demo as before with MySQL:

~ grep admin_ my.sandbox.cnf
admin_address = 127.0.0.1
admin_port = 34888

# regular port
~ mysql --host=127.0.0.1 --port=35849 --user=msandbox --password -e "SHOW GLOBAL VARIABLES WHERE Variable_name IN ('port', 'admin_address', 'admin_port');"
Enter password:
ERROR 1040 (HY000): Too many connections

# admin interface and port
~ mysql --host=127.0.0.1 --port=34888 --user=msandbox --password -e "SHOW GLOBAL VARIABLES WHERE Variable_name IN ('port', 'admin_address', 'admin_port');"a
Enter password:
+---------------+-----------+
| Variable_name | Value     |
+---------------+-----------+
| admin_address | 127.0.0.1 |
| admin_port    | 34888     |
| port          | 35849     |
+---------------+-----------+

Note that for Percona Server 8.0.14 and newer, the process will be the same as for MySQL Community.

Help! I need to login but I don’t have an extra port!

If this is the reason you are reading this post, then you can either follow the crazy GDB hack (no offense meant, Aurimas! Just seems risky :-D) or terminate the instance. The good part is that (most times) you can terminate the instance in a clean fashion by using SIGTERM (-15) instead of SIGKILL (-9). This will tell the server it should perform a clean shutdown, which will give threads a chance to exit gracefully. To do so simply run these:

1) Get PID

marcos.albe in ~/ pgrep -x mysqld;
650

2) And then send SIGTERM to that PID:

marcos.albe in ~/ kill -15 650;

3) You can now tail the error log to watch the shutdown happening; You should see a sequence like

2019-07-11T13:43:28.421244Z 0 [Note] Giving 0 client threads a chance to die gracefully
2019-07-11T13:43:28.521238Z 0 [Note] Shutting down slave threads
2019-07-11T13:43:28.521272Z 0 [Note] Forcefully disconnecting 0 remaining clients

That signals the beginning of the shutdown sequence. Then you should wait for a line like the one below to appear, to know the shutdown is complete:

2019-07-11T13:43:31.292836Z 0 [Note] /opt/percona_server/5.7.26/bin/mysqld: Shutdown complete

Written by in: MySQL,Zend Developer |
Jul
23
2019
--

Google updates its speech tech for contact centers

Last July, Google announced its Contact Center AI product for helping businesses get more value out of their contact centers. Contact Center AI uses a mix of Google’s machine learning-powered tools to help build virtual agents and help human agents as they do their job. Today, the company is launching several updates to this product that will, among other things, bring improved speech recognition features to the product.

As Google notes, its automated speech recognition service gets to very high accuracy rates, even on the kind of noisy phone lines that many customers use to complain about their latest unplanned online purchase. To improve these numbers, Google is now launching a feature called “Auto Speech Adaptation in Dialogflow,” (with Dialogflow being Google’s tool for building conversational experiences). With this, the speech recognition tools are able to take into account the context of the conversation and hence improve their accuracy by about 40%, according to Google.

Speech Recognition Accuracy

In addition, Google is launching a new phone model for understanding short utterances, which is now about 15% more accurate for U.S. English, as well as a number of other updates that improve transcription accuracy, make the training process easier and allow for endless audio streaming to the Cloud Speech-to-Text API, which previously had a five-minute limit.

If you want to, you also can now natively download MP3s of the audio (and then burn them to CDs, I guess).

dialogflow virtual agent.max 1100x1100

Jul
23
2019
--

CircleCI closes $56M Series D investment as market for continuous delivery expands

CircleCI launched way back in 2011 when the notion of continuous delivery was just a twinkle in most developers’ eyes, but over the years with the rise of agile, containerization and DevOps, we’ve seen the idea of continuous integration and continuous delivery (CI/CD) really begin to mainstream with developers. Today, CircleCI was rewarded with a $56 million Series D investment.

The round was led by Owl Rock Capital Partners and Next Equity. Existing investors Scale Venture Partners, Top Tier Capital, Threshold Ventures (formerly DFJ), Baseline Ventures, Industry Ventures, Heavybit and Harrison Metal Capital also participated in the round. CircleCI’s most recent funding prior to this round was a $31 million Series C last January. Today’s investment brings the total raised to $115.5 million, according to the company.

CircleCI CEO Jim Rose sees a market that’s increasingly ready for the product his company is offering. “As we’re putting more money to work, there are just more folks that are now moving away from aspiring about doing continuous delivery and really leaning into the idea of, ‘We’re a software company, we need to know how to do this well, and we need to be able to automate all the steps between the time our developers are making changes to the code until that application gets in front of the customer,’ ” Rose told TechCrunch.

Rose sees a market that’s getting ready to explode and he wants to use the runway this money provides his company to take advantage of that growth. “Now, what we’re finding is that fintech companies, insurance companies, retailers — all of the more traditional brands — are now realizing they’re in a software business as well. And they’re really trying to build out the tool sets and the expertise to be effective at that. And so the real growth in our market is still right in front of us,” he said.

As CircleCI matures and the market follows suit, a natural question following a Series D investment is when the company might go public, but Rose was not ready to commit to anything yet. “We come at it from the perspective of keeping our heads down trying to build the best business and doing right by our customers. I’m sure at some point along the journey our investors will be itching for liquidity, but as it stands right now, everyone is really [focused]. I think what we have found is that the bulk of the market is just starting to arrive,” he said.

Jul
23
2019
--

Arrcus snags $30M Series B as it tries to disrupt networking biz

Arrcus has a bold notion to try and take on the biggest names in networking by building a better networking management system. Today it was rewarded with a $30 million Series B investment led by Lightspeed Venture Partners.

Existing investors General Catalyst and Clear Ventures also participated. The company previously raised a seed and Series A totaling $19 million, bringing the total raised to date to $49 million, according to numbers provided by the company.

Founder and CEO Devesh Garg says the company wanted to create a product that would transform the networking industry, which has traditionally been controlled by a few companies. “The idea basically is to give you the best-in-class [networking] software with the most flexible consumption model at the lowest overall total cost of ownership. So you really as an end customer have the choice to choose best-in-class solutions,” Garg told TechCrunch.

This involves building a networking operating system called ArcOS to run the networking environment. For now, that means working with manufacturers of white-box solutions and offering some combination of hardware and software, depending on what the customer requires. Garg says that players at the top of the market like Cisco, Arista and Juniper tend to keep their technical specifications to themselves, making it impossible to integrate ArcOS with those companies at this time, but he sees room for a company like Arrcus .

“Fundamentally, this is a very large marketplace that’s controlled by two or three incumbents, and when you have lack of competition you get all of the traditional bad behavior that comes along with that, including muted innovation, rigidity in terms of the solutions that are provided and these legacy procurement models, where there’s not much flexibility with artificially high pricing,” he explained.

The company hopes to fundamentally change the current system with its solutions, taking advantage of unbranded hardware that offers a similar experience but can run the Arrcus software. “Think of them as white-box manufacturers of switches and routers. Oftentimes, they come from Taiwan, where they’re unbranded, but it’s effectively the same components that are used in the same systems that are used by the [incumbents],” he said.

The approach seems to be working, as the company has grown to 50 employees since it launched in 2016. Garg says that he expects to double that number in the next six-nine months with the new funding. Currently the company has double-digit paying customers and more than 20 in various stages of proofs of concepts, he said.

Jul
23
2019
--

PMM for MongoDB: Quick Start Guide

PMM for MongoDB

As a Solutions Engineer at Percona, one of my responsibilities is to support our customer-facing roles such as the sales and customer success teams, which affords me the opportunity to speak to many current and new customers who partner with Percona. I often find that many people are interested in Percona Monitoring and Management (PMM) as a free and open-source monitoring solution due to its robust monitoring capabilities when compared to many SaaS-based monitoring solutions. They are interested in installing PMM for MongoDB for the first time and want a “quick start guide” with a brief overview to get their feet wet. I have included the commands to get started for both PMM 1 and PMM 2 (PMM2 is still in beta).

PMM for MongoDB

Overview and Architecture

PMM is an open-source platform for out-of-the-box management and monitoring of MySQL, MongoDB, and PostgreSQL performance, on-premise and in the cloud. It is developed by Percona in collaboration with experts in the field of managed database services, support, and consulting. PMM is built off of Prometheus, a powerful open-source monitoring and alerting platform, and supports any other service that has an exporter. An exporter is an endpoint that collects data on the instance being monitored and is polled by Prometheus to collect metrics. For more information on how to use your own exporters, read the documentation here.

When deployed on-premises, the PMM platform is based on a client-server model that enables scalability. It includes the following modules:

  • PMM Client– installed on every database host that you want to monitor. It collects server metrics, general system metrics, and Query Analytics data for a complete performance overview.
  • PMM Server – the central part of PMM that aggregates collected data and presents it in the form of tables, dashboards, and graphs in a web interface.

PMM can also be deployed to support DBaaS instances for remoting monitoring. Instructions can be found here, under the Advanced section. The drawback of this approach is that you will not have visibility of host-level metrics (CPU, memory, and disk activity will not be captured nor displayed in PMM). There are currently 3 different deployment options:

For a more detailed overview of the PMM Architecture please read the Overview of PMM Architecture.

Demonstration Environment

When deploying PMM in this example, I am making the following assumptions about the environment:

  • MongoDB and the monitoring host are running on Debian based operating systems. (For information on installing as an RPM instead please read Deploying Percona Monitoring and Management.)
  • MongoDB is already installed and setup. The username and password for the MongoDB user are percona:percona.
  • The PMM server will be installed within a docker container on a dedicated host.

Installing PMM Server

This process will consist of two steps:

  1. Create the docker container – docker will automatically pull the PMM Server image from the Percona docker repository.
  2. Start (or run) the docker container – docker will bring up the PMM Server in the container

Create the Docker Container

The code below illustrates the command for creating the docker container for PMM 1:

docker create \
  -v /opt/prometheus/data \
  -v /opt/consul-data \
  -v /var/lib/mysql \
  -v /var/lib/grafana \
  --name pmm-data \
  percona/pmm-server:1 /bin/true

The code below illustrates the command for creating the docker container for PMM 2:

docker create -v /srv --name pmm-data-2-0-0-beta1 perconalab/pmm-server:2.0.0-beta1 /bin/true

This is the expected output from the code:

Use the following command to start the PMM 1 docker container:

docker run -d \
   -p 80:80 \
   --volumes-from pmm-data \
   --name pmm-server \
   --restart always \
   percona/pmm-server:1

Use the following command to start the PMM 2 docker container:

docker run -d -p 80:80 -p 443:443 --volumes-from pmm-data-2-0-0-beta1 --name pmm-server-2.0.0-beta1 --restart always perconalab/pmm-server:2.0.0-beta1

This is the expected output from the code:

The PMM Server should now be installed! Yes, it IS that easy. In order to check that you can access PMM, navigate in a browser to the IP address of the monitoring host. If you are using PMM 2, the default username and password for viewing PMM is admin:admin. You should arrive at a page that looks like https://pmmdemo.percona.com.

Installing PMM Client for MongoDB

Setting up DB permissions

PMM Query Analytics for MongoDB requires the user of the mongodb_exporter to have the clusterMonitor role assigned for the admin database and the read role for the local database. If you do not have these set up already, please read Configuring MongoDB for Monitoring in PMM Query Analytics.

Download the Percona repo package

We must first enable the Percona package repository on our MongoDB instance and install the PMM Client. We can run the following commands in order to accomplish this:

$ wget https://repo.percona.com/apt/percona-release_latest.generic_all.deb
$ sudo dpkg -i percona-release_latest.generic_all.deb
$ sudo apt-get update

Since PMM 2 is still not GA, you’ll need to leverage our experimental release of the Percona repository. You’ll need to download and install the official percona-release package from Percona and use it to enable the Percona experimental component of the original repository. See percona-release official documentation for further details on this new tool. The following commands can be used for PMM 2:

$ wget https://repo.percona.com/apt/percona-release_latest.generic_all.deb
$ sudo dpkg -i percona-release_latest.generic_all.deb
$ sudo percona-release disable all
$ sudo percona-release enable original experimental
$ sudo apt-get update

Now that we have the MongoDB database server configured with the Percona software repository, we can download the agent software with the local package manager.  Enter the following command to automatically download and install the PMM Client package on the MongoDB server:

$ sudo apt-get install pmm-client

To download and install the PMM 2 Client:

$ apt-get install pmm2-client

Next, we will configure the PMM client by telling it where to find the PMM server.  Execute the following command to configure the PMM client:

$ sudo pmm-admin config --server=<pmm_server_ip>:80

To configure the PMM 2 Client:

$ pmm-admin config --server-insecure-tls --server-url=https://<pmm_server_ip>:443

You should get a similar output as below if it was successful:

Now we provide the PMM Client credentials necessary for monitoring the MongoDB database.  Execute the following command to start monitoring and communicating with the PMM server:

$ sudo pmm-admin add mongodb --uri mongodb://percona:percona@127.0.0.1:27017

To start monitoring and communicating with the PMM 2 Server:

$ sudo pmm-admin add mongodb --use-profiler  --server-insecure-tls --username=percona  --password=percona --server-url=https://<pmm_ip>:443

You should get a similar output as below if it was successful:

Great! We have successfully installed PMM for MongoDB and are ready to take a look at the dashboards.

PMM for MongoDB Dashboards Overview

Navigate to the IP address of your monitoring host. http://<pmm_server_ip>.

PMM Home Dashboard – The Home Dashboard for PMM gives an overview of your entire environment to include all the systems you have connected and configured for monitoring under PMM. It provides useful metrics such as CPU utilization, RAM availability, database connections, and uptime.

Percona Monitoring and Management Dashboard

Cluster Summary – it shows the statistics for the selected MongoDB cluster such as counts of sharded and un-sharded databases, shard and chunk statistics, and various mongos statistics.

MongoDB Cluster Summary

MongoDB Overview – this provides basic information about MongoDB instances such as connections, command operations, and document operations.

MongoDB Overview

ReplSet – provides information about replica sets and their members such as replication operations, replication lag, and member state uptime.

ReplSet

WiredTiger/MMAPv1/In-Memory/RocksDB – it contains metrics that describe the performance of the selected host storage engine.

WiredTiger/MMAPv1/In-Memory/RocksDB

Query Analytics – this allows you to analyze database queries over periods of time. This can help you optimize database performance by ensuring queries are executed as expected and within the shortest amount of time. If you are having performance issues, this is a great place to see which queries may be the cause of your performance issues and get detailed metrics for them.

PMM Query Analytics

What Now?

Now that you have PMM for MongoDB up and running, I encourage you to explore in-depth more of the graphs and features. A few other MongoDB PMM blog posts which may be of interest:

If you run into issues during the install process, a good place to start is Peter Zaitsev’s blog post on PMM Troubleshooting.

Jul
23
2019
--

Analytics startup Heap raises $55M

Since co-founding Heap, CEO Matin Movassate has been saying that he wants to take on the analytics incumbents. Today, he’s got more money to fund that challenge, with the announcement that Heap has raised $55 million in Series C funding.

Movassate (pictured above) previously worked as a product manager at Facebook, and when I interviewed him after the startup’s Series B, he recalled the circuitous process normally required to collect and analyze user data. In contrast, Heap automatically collects data on user activity — the goal is to capture literally everything — and makes it available in a self-serve way, with no additional code required to answer new queries.

The company says it now has more than 6,000 customers, including Twilio, AppNexus, Harry’s, WeWork and Microsoft.

With this new funding, Heap has raised a total of $95.2 million. The plan is to fund international growth, as well as expand the product, engineering and go-to-market teams.

The Series C was led by NewView Capital, with participation from new DTCP, Maverick Ventures, Triangle Peak Partners, Alliance Bernstein Private Credit Investors, Sharespost and existing investors (NEA, Menlo Ventures, Initialized Capital and Pear VC). NewView founder and managing partner Ravi Viswanathan is joining the startup’s board of directors.

“Heap offers an innovative approach to automating a company’s analytics, enabling a variety of teams within an organization to obtain the data they need to make educated and, ultimately, smarter decisions,” Viswanathan said in a statement. “We are excited to team up with Heap, as they continue to develop their cutting edge software, expand their analytics automation offerings and help serve their growing numbers of customers.”

Jul
23
2019
--

TrustRadius, a customer-generated B2B software review platform, raises $12.5M

Customer reviews play a key role in helping people decide what to buy on consumer-focused marketplaces like Amazon or app stores, and the same tendency exists in the B2B world, where nearly half a trillion dollars is spent annually on software and IT purchases. TrustRadius, one of the startups capitalising on the latter trend, with total feedback sessions today standing at close to 190,000 reviews, has now picked up a Series C of $12.5 million led by Next Coast Ventures, with existing investors Mayfield Fund and LiveOak Ventures also participating.

The funding, which brings the total raised by TrustRadius to $25 million (modest compared to some of its competitors), will be used to build more partnerships and use cases for its reviews, as well as continue expanding that total number of users providing feedback.

In addition to its main site — which goes up against a huge number of other online software comparison services like TrustPilot, G2 Crowd, Owler and many others — TrustRadius is already working with vendors like LogMeIn, Tibco and more (including a number of huge IT companies that have asked not to be named).

TrustRadius mainly works with them on two tracks: to source a wider range of reviews from their existing customer bases to improve their profiles on the site; and then to help them use those reviews in their own marketing materials. Partnerships like these form the core of TrustRadius’s business model: people posting reviews or using the site to read them access it for free.

Vinay Bhagat, founder and CEO of TrustRadius, believes that his company’s mission — to help IT decision makers vet software by tapping into feedback from other IT buyers — has found particular relevance in the current market.

“I think that gravity is on our side,” he said in an interview. “If you think about how the tech industry is evolving and getting things done, IT decisions are getting decentralized and moving out of the CIO’s office. Millennials are ageing into positions of authority, and it means that the way people had previously bought software — by way of salespeople or on the basis of analyst reports — are changing. There is pent-up demand to hear the roar of peers and that’s where we come in.”

User-generated reviews have come under a lot of criticism in recent times. Regulators have been going after companies for not being vigilant enough about policing their platforms for “fake” reviews, either planted to big-up a product, or by rivals to knock it down, or coming from people who are being paid to put in a good word. The argument has been that the marketplaces hosting those reviews are still bringing in eyeballs and product conversions based on that feedback, so they are less concerned with the corruption even if it longer term can likely sour consumers on the trustworthiness of the whole platform.

That belief is not wholly true, of course: Amazon for one has recently been making a huge effort to improve trust, by going after dodgy reviewers and setting up systems to halt the trafficking of counterfeit goods.

And Bhagat argued to me that it doesn’t hold for TrustRadius, either. The company has a focused enough mandate — B2B software purchasing — within a crowded enough field, that losing trust by posting blindly positive reviews would get it nowhere fast.

At the same time, he noted that the company has held a firm line with its customers on making sure that the “truth” about a product is made clear even if it’s not completely rosy, in the hopes that they can use that to work on improvements, and also provide more balanced feedback at the least from existing customers in order to give a more complete picture. (It also, like other reviews sites, makes people who provide feedback do so using professional credentials like work emails and LinkedIn profiles.)

That line has so far carried it into relationships with a number of software companies, which are using reviews as a complement to their own sales teams, and the papers and analysis published by analysts like Gartner and Ovum and Forester, to reach people who are weighing up different options for their IT solutions.

“TrustRadius has become an integral part of today’s economic cycle,” said Bill Wagner, CEO of LogMeIn, in a statement. “Software buyers today need detailed reviews to make sure that the product works for a business professional like themselves. TrustRadius provides that in a transparent way, so buyers can make confident decisions, even about enterprise-grade software.”

The recent swing in the digital world toward data protection and people getting increasingly aware of how their own personal details are used in ways they never intended has presented an interesting challenge for the world of online services. Most of us don’t like getting marketing and will generally opt out of any “yes, I consent to getting updates from XYZ and its partners!” boxes — if we happen to spot them amid the dark patterning of the net.

TrustRadius and companies like it have an opportunity through that, though: by targeting IT buyers who have to make complicated purchasing decisions and most likely more than one, and in a way that ensures each purchase works with the rest of an existing tech stack, they represent one of the rare cases where a user might actually want to hear more.

Indeed, one of the company’s plans longer term is to continue developing how it can work with its users through that IT life cycle by providing suggestions of software based on previous software purchases and also what that users’ feedback has been around a past purchase.

“From day one we have been dealing with complex purchasing decisions,” Bhagat said. “Buying technology that will be used to run your business is not the same as buying an app that you use casually. It can be make or break for your company.”

Jul
22
2019
--

In spite of slowing growth, Microsoft has been flexing its cloud muscles

When Microsoft reported its FY19, Q4 earnings last week, the numbers were mostly positive, but as we pointed out, Azure earnings growth has stalled. Productivity and business, which includes Office 365, has also mostly flattened out. But slowing growth is not always as bad as it may seem. In fact, it’s an inevitability that once you start to reach Microsoft’s market maturity, it gets harder to maintain large growth numbers.

That said, AWS launched the first cloud infrastructure service, Amazon Elastic Compute Cloud in August, 2006. Microsoft came much later to the cloud, launching Azure in February, 2010, but so were other established companies in Microsoft’s market share rearview. What did it do differently to achieve this success that the companies chasing it — Google, IBM and Oracle — failed to do? It’s a key question.

Let’s look at some numbers

For starters, let’s look at the most numbers for Productivity & Business Processes this year. This category includes all of its commercial and consumer SaaS products including Office 365 commercial and consumer, Dynamics 365, LinkedIn and others. The percentage growth started FY19 at 19% but ended at 14%

Screenshot 2019 07 19 14.34.00

When you look at just Office365 commercial earnings growth, it started at 36% and dropped down to 31% by Q4.

Jul
22
2019
--

Google Cloud makes it easier to set up continuous delivery with Spinnaker

Google Cloud today announced Spinnaker for Google Cloud Platform, a new solution that makes it easier to install and run the Spinnaker continuous delivery (CD) service on Google’s cloud.

Spinnaker was created inside Netflix and is now jointly developed by Netflix and Google. Netflix open-sourced it back in 2015 and over the course of the last few years, it became the open-source CD platform of choice for many enterprises. Today, companies like Adobe, Box, Cisco, Daimler, Samsung and others use it to speed up their development process.

With Spinnaker for Google Cloud Platform, which runs on the Google Kubernetes Engine, Google is making the install process for the service as easy as a few clicks. Once up and running, the Spinnaker install includes all of the core tools, as well as Deck, the user interface for the service. Users pay for the resources used by the Google Kubernetes Engine, as well as Cloud Memorystore for Redis, Google Cloud Load Balancing and potentially other resources they use in the Google Cloud.

could spinnker.max 1100x1100

The company has pre-configured Spinnaker for testing and deploying code on Google Kubernetes Engine, Compute Engine and App Engine, though it also will work with any other public or on-prem cloud. It’s also integrated with Cloud Build, Google’s recently launched continuous integration service, and features support for automatic backups and integrated auditing and monitoring with Google’s Stackdriver.

“We want to make sure that the solution is great both for developers and DevOps or SRE teams,” says Matt Duftler, tech lead for Google’s Spinnaker effort, in today’s announcement. “Developers want to get moving fast with the minimum of overhead. Platform teams can allow them to do that safely by encoding their recommended practice into Spinnaker, using Spinnaker for GCP to get up and running quickly and start onboard development teams.”


Jul
22
2019
--

Percona Monitoring and Management (PMM) 2 Beta 4 Is Now Available

Percona Monitoring and Management

Percona Monitoring and Management

We are pleased to announce our 4th Beta release of PMM 2! PMM (Percona Monitoring and Management) is a free and open-source platform for managing and monitoring MySQL, MongoDB, and PostgreSQL performance. With this release we’ve made the following improvements since our last public Beta at the end of May:

  • Query Analytics
    • PostgreSQL – Aggregate & identify slow queries from pg_stat_statements data source
    • Interface updates – label improvements, sparkline updates, tooltips
  • PMM Server Monitoring  – look for pmm-server in Dashboards and Query Analytics
  • ProxySQL monitoring – now available using pmm-admin add proxysql
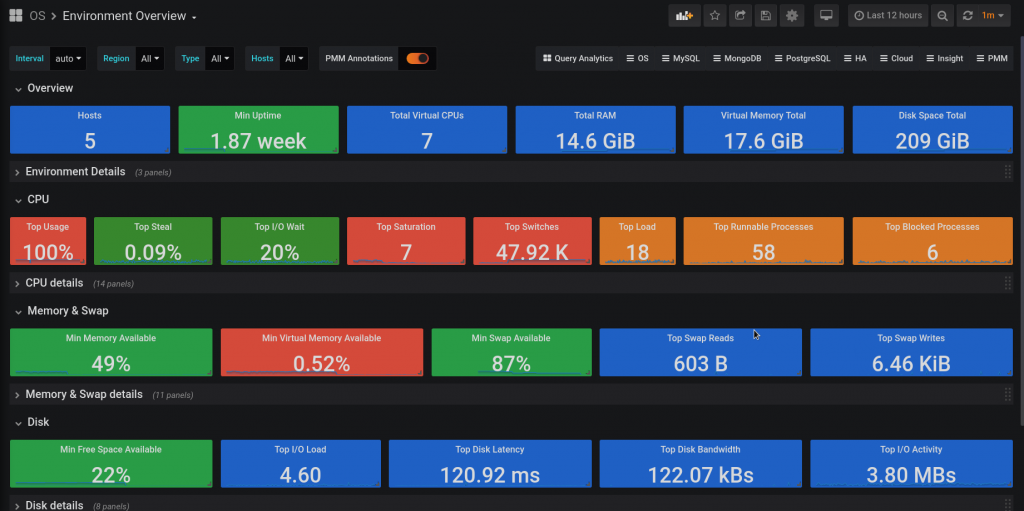
  • Environment Overview Dashboard – Updated layout and colours – take a look!
  • Debian 10 support we now have pmm2-client deb packages for Debian 10

PMM 2 is still a work in progress – you may encounter some bugs and missing features. We are aware of a number of issues, but please report any and all that you find to Percona’s JIRA.

This release is not recommended for production environments.  PMM 2 is designed to be used as a new installation – please don’t try to upgrade your existing PMM 1 environment.

Query Analytics Dashboard Enhancements

Query Analytics for PostgreSQL

We’re excited to provide Query Analytics for PostgreSQL in this release, where you can now visualize query activity for PostgreSQL. Monitoring PostgreSQL queries is achieved via the popular pg_stat_statements extension.

Query Analytics Interface Updates

We spent some time updating Sparklines logic to be more accurate:

We now wrap long labels, and shorten in some cases with a hint to show the full label name:

We’re incrementally improving our Query Analytics to better explain what we’re measuring with the addition of tooltips:

PMM Server Monitoring

To better understand resource utilization on your PMM Server host, we’ve added a pmm-server entry in the OS, PostgreSQL, Prometheus, and Query Analytics Dashboards:

Query Analytics for PostgreSQL – pmm-server

You can explore the queries that are executed by Query Analytics:

ProxySQL support

You can now add ProxySQL instance to PMM and take advantage of the ProxySQL Overview Dashboard, which resides under the HA group in the system menu.

Simplified Environment Overview Dashboard

We’ve categorized the dashboard into several sections. The first two sections show total information for the entire environment as well as Top and Min values:

We also display the label name and current value, and you can click each object in order to drill down for greater detail:

We’ve started collapsing some rows by default, in order to minimize the visual clutter. Opening each category automatically refreshes the dashboard:

Installation and configuration

The default PMM Server credentials are:

username: admin
password: admin

Install PMM Server with docker

The easiest way to install PMM Server is to deploy it with Docker. Running the PMM 2 Docker container with PMM Server can be done by the following commands (note the version tag of 2.0.0-beta4):

docker create -v /srv --name pmm-data-2-0-0-beta4 perconalab/pmm-server:2.0.0-beta4 /bin/true
docker run -d -p 80:80 -p 443:443 --volumes-from pmm-data-2-0-0-beta4 --name pmm-server-2.0.0-beta4 --restart always perconalab/pmm-server:2.0.0-beta4

Install PMM Client

Since PMM 2 is still not GA, you’ll need to leverage our experimental release of the Percona repository. You’ll need to download and install the official percona-release package from Percona and use it to enable the Percona experimental component of the original repository. See percona-release official documentation for further details on this new tool.

Specific instructions for a Debian system are as follows:

wget https://repo.percona.com/apt/percona-release_latest.generic_all.deb
sudo dpkg -i percona-release_latest.generic_all.deb

Now enable the experimental repo:

sudo percona-release disable all
sudo percona-release enable original experimental

Install pmm2-client package:

apt-get update
apt-get install pmm2-client

Users who have previously installed pmm2-client alpha version should remove the package and install a new one in order to update to beta1.

Please note that leaving experimental repository enabled may affect further package installation operations with bleeding-edge software that may not be suitable for Production. You can revert by disabling experimental via the following commands:

sudo percona-release disable original experimental
sudo apt-get update

Configure PMM

Once PMM Client is installed, run the pmm-admin config command with your PMM Server IP address to register your Node:

# pmm-admin config --server-insecure-tls --server-url=https://<IP Address>:443

You should see the following:

Checking local pmm-agent status...
pmm-agent is running.
Registering pmm-agent on PMM Server...
Registered.
Configuration file /usr/local/percona/pmm-agent.yaml updated.
Reloading pmm-agent configuration...
Configuration reloaded.

Adding MySQL Metrics and Query Analytics

MySQL server can be added for the monitoring in its normal way. Here is a command which adds it using the PERFORMANCE_SCHEMA source:

pmm-admin add mysql --query-source='perfschema' --username=pmm --password=pmm

where username and password are credentials for the monitored MySQL access, which will be used locally on the database host.

The syntax to add MySQL services (Metrics and Query Analytics) using the Slow Log source is the following:

pmm-admin add mysql --query-source='slowlog' --username=pmm --password=pmm

When the server is added, you can check your MySQL dashboards and Query Analytics in order to view its performance information!

Adding MongoDB Metrics and Query Analytics

You can add MongoDB services (Metrics and Query Analytics) with a similar command:

pmm-admin add mongodb --use-profiler --username=pmm --password=pmm

Adding PostgreSQL monitoring service

You can add PostgreSQL service as follows:

pmm-admin add postgresql --username=pmm --password=pmm

You can then check your PostgreSQL Overview dashboard.

Add ProxySQL monitoring service

You can add ProxySQL service as follows:

pmm-admin add proxysql --username=admin --password=admin

You can then check your ProxySQL Overview dashboard.

About Percona Monitoring and Management

Percona Monitoring and Management (PMM) is a free and open-source platform for managing and monitoring MySQL®, MongoDB®, and PostgreSQL® performance. You can run PMM in your own environment for maximum security and reliability. It provides thorough time-based analysis for MySQL®, MongoDB®, and PostgreSQL® servers to ensure that your data works as efficiently as possible.

Help us improve our software quality by reporting any Percona Monitoring and Management bugs you encounter using our bug tracking system.

Powered by WordPress | Theme: Aeros 2.0 by TheBuckmaker.com