Mar
20
2023
--

Comparisons of Proxies for MySQL

mysql proxy

With a special focus on Percona Operator for MySQL

Overview

HAProxy, ProxySQL, MySQL Router (AKA MySQL Proxy); in the last few years, I had to answer multiple times on what proxy to use and in what scenario. When designing an architecture, many components need to be considered before deciding on the best solution.

When deciding what to pick, there are many things to consider, like where the proxy needs to be, if it “just” needs to redirect the connections, or if more features need to be in, like caching and filtering, or if it needs to be integrated with some MySQL embedded automation.

Given that, there never was a single straight answer. Instead, an analysis needs to be done. Only after a better understanding of the environment, the needs, and the evolution that the platform needs to achieve is it possible to decide what will be the better choice.

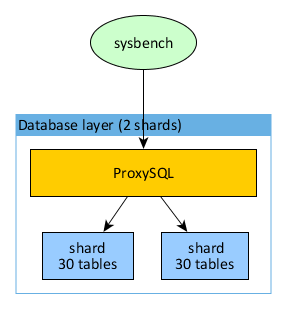
However, recently we have seen an increase in the usage of MySQL on Kubernetes, especially with the adoption of Percona Operator for MySQL. In this case, we have a quite well-defined scenario that can resemble the image below:

MySQL on Kubernetes

In this scenario, the proxies must sit inside Pods, balancing the incoming traffic from the Service LoadBalancer connecting with the active data nodes.

Their role is merely to be sure that any incoming connection is redirected to nodes that can serve them, which includes having a separation between Read/Write and Read Only traffic, a separation that can be achieved, at the service level, with automatic recognition or with two separate entry points.

In this scenario, it is also crucial to be efficient in resource utilization and scaling with frugality. In this context, features like filtering, firewalling, or caching are redundant and may consume resources that could be allocated to scaling. Those are also features that will work better outside the K8s/Operator cluster, given the closer to the application they are located, the better they will serve.

About that, we must always remember the concept that each K8s/Operator cluster needs to be seen as a single service, not as a real cluster. In short, each cluster is, in reality, a single database with high availability and other functionalities built in.

Anyhow, we are here to talk about Proxies. Once we have defined that we have one clear mandate in mind, we need to identify which product allows our K8s/Operator solution to:

  • Scale at the maximum the number of incoming connections
  • Serve the request with the higher efficiency
  • Consume as fewer resources as possible

The environment

To identify the above points, I have simulated a possible K8s/Operator environment, creating:

  • One powerful application node, where I run sysbench read-only tests, scaling from two to 4096 threads. (Type c5.4xlarge)
  • Three mid-data nodes with several gigabytes of data in with MySQL and Group Replication (Type m5.xlarge)
  • One proxy node running on a resource-limited box (Type t2.micro)

The tests

We will have very simple test cases. The first one has the scope to define the baseline, identifying the moment when we will have the first level of saturation due to the number of connections. In this case, we will increase the number of connections and keep a low number of operations.

The second test will define how well the increasing load is served inside the previously identified range. 

For documentation, the sysbench commands are:

Test1

sysbench ./src/lua/windmills/oltp_read.lua  --db-driver=mysql --tables=200 --table_size=1000000 
 --rand-type=zipfian --rand-zipfian-exp=0 --skip_trx=true  --report-interval=1 --mysql-ignore-errors=all 
--mysql_storage_engine=innodb --auto_inc=off --histogram  --stats_format=csv --db-ps-mode=disable --point-selects=50 
--reconnect=10 --range-selects=true –rate=100 --threads=<#Threads from 2 to 4096> --time=1200 run

Test2

sysbench ./src/lua/windmills/oltp_read.lua  --mysql-host=<host> --mysql-port=<port> --mysql-user=<user> 
--mysql-password=<pw> --mysql-db=<schema> --db-driver=mysql --tables=200 --table_size=1000000  --rand-type=zipfian 
--rand-zipfian-exp=0 --skip_trx=true  --report-interval=1 --mysql-ignore-errors=all --mysql_storage_engine=innodb 
--auto_inc=off --histogram --table_name=<tablename>  --stats_format=csv --db-ps-mode=disable --point-selects=50 
--reconnect=10 --range-selects=true --threads=<#Threads from 2 to 4096> --time=1200 run

Results

Test 1

As indicated here, I was looking to identify when the first Proxy will reach a dimension that would not be manageable. The load is all in creating and serving the connections, while the number of operations is capped at 100. 

As you can see, and as I was expecting, the three Proxies were behaving more or less the same, serving the same number of operations (they were capped, so why not) until they weren’t.

MySQL router, after the 2048 connection, could not serve anything more.

NOTE: MySQL Router actually stopped working at 1024 threads, but using version 8.0.32, I enabled the feature: connection_sharing. That allows it to go a bit further.  

Let us take a look also the latency:

latency threads

Here the situation starts to be a little bit more complicated. MySQL Router is the one that has the higher latency no matter what. However, HAProxy and ProxySQL have interesting behavior. HAProxy performs better with a low number of connections, while ProxySQL performs better when a high number of connections is in place.  

This is due to the multiplexing and the very efficient way ProxySQL uses to deal with high load.

Everything has a cost:

HAProxy is definitely using fewer user CPU resources than ProxySQL or MySQL Router …

HAProxy

.. we can also notice that HAProxy barely reaches, on average, the 1.5 CPU load while ProxySQL is at 2.50 and MySQL Router around 2. 

To be honest, I was expecting something like this, given ProxySQL’s need to handle the connections and the other basic routing. What was instead a surprise was MySQL Router, why does it have a higher load?

Brief summary

This test highlights that HAProxy and ProxySQL can reach a level of connection higher than the slowest runner in the game (MySQL Router). It is also clear that traffic is better served under a high number of connections by ProxySQL, but it requires more resources. 

Test 2

When the going gets tough, the tough get going

Let’s remove the –rate limitation and see what will happen. 

mysql events

The scenario with load changes drastically. We can see how HAProxy can serve the connection and allow the execution of more operations for the whole test. ProxySQL is immediately after it and behaves quite well, up to 128 threads, then it just collapses. 

MySQL Router never takes off; it always stays below the 1k reads/second, while HAProxy served 8.2k and ProxySQL 6.6k.

mysql latency

Looking at the latency, we can see that HAProxy gradually increased as expected, while ProxySQL and MySQL Router just went up from the 256 threads on. 

To observe that both ProxySQL and MySQL Router could not complete the tests with 4096 threads.

ProxySQL and MySQL Router

Why? HAProxy always stays below 50% CPU, no matter the increasing number of threads/connections, scaling the load very efficiently. MySQL router was almost immediately reaching the saturation point, being affected by the number of threads/connections and the number of operations. That was unexpected, given we do not have a level 7 capability in MySQL Router.

Finally, ProxySQL, which was working fine up to a certain limit, reached saturation point and could not serve the load. I am saying load because ProxySQL is a level 7 proxy and is aware of the content of the load. Given that, on top of multiplexing, additional resource consumption was expected.   

proxysql usage

Here we just have a clear confirmation of what was already said above, with 100% CPU utilization reached by MySQL Router with just 16 threads, and ProxySQL way after at 256 threads.

Brief summary

HAProxy comes up as the champion in this test; there is no doubt that it could scale the increasing load in connection without being affected significantly by the load generated by the requests. The lower consumption in resources also indicates the possible space for even more scaling.

ProxySQL was penalized by the limited resources, but this was the game, we had to get the most out of the few available. This test indicates that it is not optimal to use ProxySQL inside the Operator; it is a wrong choice if low resource and scalability are a must.    

MySQL Router was never in the game. Unless a serious refactoring, MySQL Router is designed for very limited scalability, as such, the only way to adopt it is to have many of them at the application node level. Utilizing it close to the data nodes in a centralized position is a mistake.  

Conclusions

I started showing an image of how the MySQL service is organized and want to close by showing the variation that, for me, is the one to be considered the default approach:

MySQL service is organized

This highlights that we must always choose the right tool for the job. 

The Proxy in architectures involving MySQL/Percona Server for MySQL/Percona XtraDB Cluster is a crucial element for the scalability of the cluster, no matter if using K8s or not. Choosing the one that serves us better is important, which can sometimes be ProxySQL over HAProxy. 

However, when talking about K8s and Operators, we must recognize the need to optimize the resources usage for the specific service. In that context, there is no discussion about it, HAProxy is the best solution and the one we should go to. 

My final observation is about MySQL Router (aka MySQL Proxy). 

Unless there is a significant refactoring of the product, at the moment, it is not even close to what the other two can do. From the tests done so far, it requires a complete reshaping, starting to identify why it is so subject to the load coming from the query more than the load coming from the connections.   

Great MySQL to everyone. 

References

Nov
13
2020
--

Kubernetes Scaling Capabilities with Percona XtraDB Cluster

Kubernetes Scaling Capabilities with Percona XtraDB Cluster

Kubernetes Scaling Capabilities with Percona XtraDB ClusterOur recent survey showed that many organizations saw unexpected growth around cloud and data. Unexpected bills can become a big problem, especially in such uncertain times. This blog post talks about how Kubernetes scaling capabilities work with Percona Kubernetes Operator for Percona XtraDB Cluster (PXC Operator) and can help you to control the bill.

Resources

Kubernetes is a container orchestrator and on top of it, it has great scaling capabilities. Scaling can help you to utilize your cluster better and do not waste money on excessive capacity. But before scaling we need to understand what capacity is and how Kubernetes manages CPU and memory resources.

There are two resource concepts that you should be aware of: requests and limits. Requests is the amount of CPU or memory that a container is guaranteed to get on the node. Kubernetes uses requests during scheduling decisions, and it will not schedule a container to a node that does not have enough capacity. Limits is the maximum amount of resources that a container can get on the node. There is no guarantee though. In Linux, world limits are just cgroup maximums for processes.

Each node in a cluster has its own capacity. Part of this capacity is reserved for the operating system and kubelet, and what is left can be utilized by containers (allocatable).

resource allocation in Kubernetes

Okay, now we know a thing or two about resource allocation in Kubernetes. Let’s dive into the problem space.

Problem #1: Requested Too Much

If you request resources for containers but do not utilize them well enough, you end up wasting resources. This is where Vertical Pod Autoscaler (VPA) comes in handy. It can automatically scale up or down container requests based on its historical real usage.

request resources for containers

VPA has 3 modes:

  1. Recommender – it only provides recommendations for containers’ requests. We suggest starting with this mode.
  2. Initial – webhook applies changes to the container during its creation
  3. Auto/Recreate – webhook applies changes to the container during its creation and can also dynamically change the requests for the container

Configure VPA

As a starting point, deploy Percona Kubernetes Operator for Percona XtraDB Cluster and the database by following the guide. VPA is deployed via a single command (see the guide here). VPA requires a metrics-server to get real usage for containers.

We need to create a VPA resource that will monitor our PXC cluster and provide recommendations for requests tuning. For recommender mode set UpdateMode to “Off”:

$ cat vpa.yaml
apiVersion: autoscaling.k8s.io/v1
kind: VerticalPodAutoscaler
metadata:
  name: pxc-vpa
spec:
  targetRef:
    apiVersion: "apps/v1"
    kind:       StatefulSet
    name:       <name of the STS>
    namespace:  <your namespace>
  updatePolicy:
    updateMode: "Off"

Run the following command to get the name of the StatefulSet:

$ kubectl get sts
NAME           READY   AGE
...
cluster1-pxc   3/3     3h47m

The one with -pxc has the PXC cluster. Apply the VPA object:

$ kubectl apply -f vpa.yaml

After a few minutes you should be able to fetch recommendations from the VPA object:

$ kubectl get vpa pxc-vpa -o yaml
...
  recommendation:
    containerRecommendations:
    - containerName: pxc
      lowerBound:
        cpu: 25m
        memory: "503457402"
      target:
        cpu: 25m
        memory: "548861636"
      uncappedTarget:
        cpu: 25m
        memory: "548861636"
      upperBound:
        cpu: 212m
        memory: "5063059194"

Resources in the target section are the ones that VPA recommends and applies if Auto or Initial modes are configured. Read more here to understand other recommendation sections.

VPA will apply the recommendations once it is running in Auto mode and will persist the recommended configuration even after the pod being restarted. To enable Auto mode patch the VPA object:

$ kubectl patch vpa pxc-vpa --type='json' -p '[{"op": "replace", "path": "/spec/updatePolicy/updateMode", "value": "Auto"}]'

After a few minutes, VPA will restart PXC pods and apply recommended requests.

$ kubectl describe pod cluster1-pxc-0
...
Requests:
      cpu: “25m”
      memory: "548861636"

Delete VPA object to stop autoscaling:

$ kubectl delete vpa pxc-vpa

Please remember few things about VPA and Auto mode:

  1. It changes container requests, but does not change Deployments or StatefulSet resources.
  2. It is not application aware. For PXC, for example, it does not change
    innodb_buffer_pool_size

      which is configured to take 75% of RAM by the operator. To change it, please, set corresponding requests configuration in

    cr.yaml

    and apply.

  3. It respects
    podDistruptionBudget

    to protect your application. In our default

    cr.yaml

      PDB is configured to lose one pod at a time. It means VPA will change requests and restart one pod at a time:

    podDisruptionBudget:
      maxUnavailable: 1

Problem #2: Spiky Usage

The utilization of the application might change over time. It can happen gradually, but what if it is daily spikes of usage or completely unpredictable patterns? Constantly running additional containers is an option, but it leads to resource waste and increases in infrastructure costs. This is where Horizontal Pod Autoscaler (HPA) can help. It monitors container resources or even application metrics to automatically increase or decrease the number of containers serving the application.

Horizontal Pod Autoscaler

Looks nice, but unfortunately, the current version of the PXC Operator will not work with HPA. HPA tries to scale the StatefulSet, which in our case is strictly controlled by the operator. It will overwrite any scaling attempts from the horizontal scaler. We are researching the opportunities to enable this support for PXC Operator.

Problem #3: My Cluster is Too Big

You have tuned resources requests and they are close to real usage, but the cloud bill is still not going down. It might be that your Kubernetes cluster is overprovisioned and should be scaled with Cluster Autoscaler. CA adds and removes nodes to your Kubernetes cluster based on their requests usage. When nodes are removed pods are rescheduled to other nodes automatically.

Kubernetes cluster is overprovisioned

Configure CA

On Google, Kubernetes Engine Cluster Autoscaler can be enabled through gcloud utility. On AWS you need to install autoscaler manually and add corresponding autoscaling groups into the configuration.

In general, CA monitors if there are any pods that are in Pending status (waiting to be scheduled, read more on pod statuses here) and adds more nodes to the cluster to meet the demand. It removes nodes if it sees the possibility to pack pods densely on other nodes. To add and remove nodes it relies on the cloud primitives: node groups in GCP, auto-scaling groups in AWS, virtual machine scale set on Azure, and so on. The installation of CA differs from cloud to cloud, but here are some interesting tricks.

Overprovision the Cluster

If your workloads are scaling up CA needs to provision new nodes. Sometimes it might take a few minutes. If there is a requirement to scale faster it is possible to overprovision the cluster. Detailed instruction is here. The idea is to always run pause pods with low priority, real workloads with higher priority push them out from nodes when needed.

Expanders

Expanders control how to scale up the cluster; which nodes to add. Configure expanders and multiple node groups to fine-tune the scaling. My preference is to use priority expander as it allows us to cherry-pick the nodes by customizable priorities, it is especially useful for a rapidly changing spot market.

Safety

Pay extremely close attention to scaling down. First of all, you can disable it completely by setting

scale-down-enabled

  to

false

(not recommended). For clusters with big nodes with lots of pods be careful with

scale-down-utilization-threshold

  – do not set it to more than 50%, it might impact other nodes and overutilize them. For clusters with a dynamic workload and lots of nodes do not set

scale-down-delay-after-delete

and scale-down-unneeded-time too low, it will lead to non-stop cluster scaling with absolutely no value.

Cluster Autoscaler also respects

podDistruptionBudget

. When you run it along with PXC Operator please make sure PDBs are correctly configured, so that the PXC cluster does not crash in the event of scaling down the Kubernetes.

Conclusion

In cloud environments, day two operations must include cost management. Overprovisioning Kubernetes clusters is a common theme that can quickly become visible in the bills. When running Percona XtraDB Cluster on Kubernetes you can leverage Vertical Pod Autoscaler to tune requests and apply Cluster Autoscaler to reduce the number of instances to minimize your cloud spend. It will be possible to use Horizontal Pod Autoscaler in future releases as well to dynamically adjust your cluster to demand.

Aug
06
2018
--

Webinar Tues 8/14: Utilizing ProxySQL for Connection Pooling in PHP

ProxySQL for connection pooling

ProxySQL for connection poolingPlease join Percona’s Architect, Tibi Köröcz as he presents Utilizing ProxySQL for Connection Pooling in PHP on Tuesday August 14, 2018, at 8:00 am PDT (UTC-7) / 11:00 am EDT (UTC-4).


ProxySQL is a very powerful tool, with extended capabilities. This presentation will demonstrate how to use ProxySQL to gain functionality (seamless database backend switch) and correct problems (applications missing connection pooling).

The presentation will be a real-life study on how we use ProxySQL for connection pooling, database failover and load balancing the communication between our (third party) PHP-application and our master-master MySQL-cluster.
Also, we will show monitoring and statistics using Percona Monitoring and Management (PMM).

Register Now!

Tibor Köröcz

Architect

ProxySQL for Connection Pooling

Tibi joined Percona in 2015 as a Consultant. Before joining Percona, among many other things, he worked at the world’s largest car hire booking service as a Senior Database Engineer. He enjoys trying and working with the latest technologies and applications which can help or work with MySQL together. In his spare time he likes to spend time with his friends, travel around the world and play ultimate frisbee.


The post Webinar Tues 8/14: Utilizing ProxySQL for Connection Pooling in PHP appeared first on Percona Database Performance Blog.

Jun
19
2018
--

Webinar Weds 20/6: Percona XtraDB Cluster 5.7 Tutorial Part 2

webinar Percona XtraDB Cluster

Including setting up Percona XtraDB Cluster with ProxySQL and PMM

webinar Percona XtraDB ClusterPlease join Percona’s Architect, Tibi Köröcz as he presents Percona XtraDB Cluster 5.7 Tutorial Part 2 on Wednesday, June 20th, 2018, at 7:00 am PDT (UTC-7) / 10:00 am EDT (UTC-4).


Never used Percona XtraDB Cluster before? This is the webinar for you! In this 45-minute webinar, we will introduce you to a fully functional Percona XtraDB Cluster.

This webinar will show you how to install Percona XtraDB Cluster with ProxySQL, and monitor it with Percona Monitoring and Management (PMM).

We will also cover topics like bootstrap, IST, SST, certification, common-failure situations and online schema changes.

After this webinar, you will have enough knowledge to set up a working Percona XtraDB Cluster with ProxySQL, in order to meet your high availability requirements.

You can see part one of this series here: Percona XtraDB Cluster 5.7 Tutorial Part 1

Register Now!

Tibor Köröcz

Architect

ProxySQL for Connection Pooling

Tibi joined Percona in 2015 as a Consultant. Before joining Percona, among many other things, he worked at the world’s largest car hire booking service as a Senior Database Engineer. He enjoys trying and working with the latest technologies and applications which can help or work with MySQL together. In his spare time he likes to spend time with his friends, travel around the world and play ultimate frisbee.


The post Webinar Weds 20/6: Percona XtraDB Cluster 5.7 Tutorial Part 2 appeared first on Percona Database Performance Blog.

Jun
18
2018
--

Webinar Tues 19/6: MySQL: Scaling and High Availability – Production Experience from the Last Decade(s)

scale high availability

scale high availability
Please join Percona’s CEO, Peter Zaitsev as he presents MySQL: Scaling and High Availability – Production Experience Over the Last Decade(s) on Tuesday, June 19th, 2018 at 7:00 AM PDT (UTC-7) / 10:00 AM EDT (UTC-4).


Percona is known as the MySQL performance experts. With over 4,000 customers, we’ve studied, mastered and executed many different ways of scaling applications. Percona can help ensure your application is highly available. Come learn from our playbook, and leave this talk knowing your MySQL database will run faster and more optimized than before.

Register Now

About Peter Zaitsev, CEO

Peter Zaitsev co-founded Percona and assumed the role of CEO in 2006. As one of the foremost experts on MySQL strategy and optimization, Peter leveraged both his technical vision and entrepreneurial skills to grow Percona from a two-person shop to one of the most respected open source companies in the business. With over 140 professionals in 30 plus countries, Peter’s venture now serves over 3000 customers – including the “who’s who” of internet giants, large enterprises and many exciting startups. Percona was named to the Inc. 5000 in 2013, 2014, 2015 and 2016.

Peter was an early employee at MySQL AB, eventually leading the company’s High Performance Group. A serial entrepreneur, Peter co-founded his first startup while attending Moscow State University where he majored in Computer Science. Peter is a co-author of High Performance MySQL: Optimization, Backups, and Replication, one of the most popular books on MySQL performance. Peter frequently speaks as an expert lecturer at MySQL and related conferences, and regularly posts on the Percona Database Performance Blog. He has also been tapped as a contributor to Fortune and DZone, and his recent ebook Practical MySQL Performance Optimization Volume 1 is one of percona.com’s most popular downloads. Peter lives in North Carolina with his wife and two children. In his spare time, Peter enjoys travel and spending time outdoors.

The post Webinar Tues 19/6: MySQL: Scaling and High Availability – Production Experience from the Last Decade(s) appeared first on Percona Database Performance Blog.

Oct
17
2017
--

Webinar Wednesday, October 18, 2017: How to Scale with MongoDB

Scale with MongoDB

Scale with MongoDBJoin Percona’s Senior Technical Services Engineer Adamo Tonete as he presents How To Scale with MongoDB on Wednesday, October 18, 2017, at 11:00 am PDT / 2:00 pm EDT (UTC-7).

In this webinar, we will talk about how to scale with MongoDB, up to thousands of writes and reads per second. What are the common issues when you scale with MongoDB? Is it better to shard or to add further secondaries?

We will walk through many common scaling situations, and through the steps needed to deploy a sharded cluster: from a single instance to a sharded environment. We will also talk about common mistakes/pitfalls a company can make when scaling its database – and how to avoid such situations.

Register for the webinar.

Adamo Tonete, Senior Technical Services Engineer

Adamo joined Percona in 2015, after working as a MongoDB/MySQL database administrator for three years. As the main database member of a startup, he was responsible for suggesting the best architecture and data flows for a worldwide company in a 24×7 environment. Before that, he worked as a Microsoft SQL Server DBA for a large e-commerce company, mainly on performance tuning and automation. Adamo has almost eight years of experience working as a DBA, and in the past three has moved to NoSQL technologies without giving up relational databases. He likes to play video games and study everything that is related to engines. Adamo lives with his wife in São Paulo, Brazil.

Jun
05
2017
--

Webinar June 7, 2017: MySQL In the Cloud – Migration, Best Practices, High Availability, Scaling

MySQL in the Cloud

MySQL in the CloudJoin Percona’s CEO and Founder Peter Zaitsev as he presents MySQL In the Cloud: Migration, Best Practices, High Availability, Scaling on Wednesday, June 7, 2017, at 10 am PDT / 1:00 pm EDT (UTC-7).

Businesses are moving many of the systems and processes they once owned to offsite “service” models: Platform as a Service (PaaS), Software as a Service (SaaS), Infrastructure as a Service (IaaS), etc. These services are usually referred to as being “in the cloud” – meaning that the infrastructure and management of the service in question are not maintained by the enterprise using the service.

When it comes to database environment and infrastructure, more and more enterprises are moving to MySQL in the cloud to manage this vital part of their business organization. We often refer to database services provided in the cloud as Database as a Service (DBaaS). The next question after deciding to move your database to the cloud is “How to I plan properly to as to avoid a disaster?”

Before moving to the cloud, it is important to carefully define your database needs, plan for the migration and understand what putting a solution into production entails. This webinar discusses the following subjects on moving to the cloud:

  • Public and private cloud
  • Migration to the cloud
  • Best practices
  • High availability
  • Scaling

Register for the webinar here.

Peter ZaitsevPeter Zaitsev, Percona CEO and Founder

Peter Zaitsev co-founded Percona and assumed the role of CEO in 2006. As one of the foremost experts on MySQL strategy and optimization, Peter leveraged both his technical vision and entrepreneurial skills to grow Percona from a two-person shop to one of the most respected open source companies in the business. With over 150 professionals in 20+ countries, Peter’s venture now serves over 3000 customers – including the “who’s who” of internet giants, large enterprises and many exciting startups. Percona was named to the Inc. 5000 in 2013, 2014 and 2015.

Peter was an early employee at MySQL AB, eventually leading the company’s High Performance Group. A serial entrepreneur, Peter co-founded his first startup while attending Moscow State University where he majored in Computer Science. Peter is a co-author of High Performance MySQL: Optimization, Backups, and Replication, one of the most popular books on MySQL performance. Peter frequently speaks as an expert lecturer at MySQL and related conferences, and regularly posts on the Percona Database Performance Blog. Fortune and DZone often tap Peter as a contributor, and his recent ebook Practical MySQL Performance Optimization is one of percona.com’s most popular downloads.

Apr
22
2017
--

Better Than Linear Scaling

Scalability

In this blog, we’ll look at how to achieve better-than-linear scaling.

Scalability is the capability of a system, network or process to handle a growing amount of work, or its potential to be enlarged to accommodate that growth. For example, we consider a system scalable if it is capable of increasing its total output under an increased load when resources (typically hardware) are added: https://en.wikipedia.org/wiki/Scalability.

It is often accepted as a fact that systems (in particular databases) can’t scale better than linearly. By this I mean when you double resources, the expected performance doubles, at best (and often is less than doubled).  

We can attribute this assumption to Amdahl’s law (https://en.wikipedia.org/wiki/Amdahl%27s_law), and later to the Universal Scalability Law (http://www.perfdynamics.com/Manifesto/USLscalability.html). Both these laws prescribe that it is impossible to achieve better than linear scalability. To be totally precise, this is practically correct for single server systems when the added resources are only CPU units.

Multi-nodes systems

However, I think databases systems no longer should be seen as single server systems. MongoDB and Cassandra for a long time have had multi-node auto-sharding capabilities. We are about to see the rise of strongly-consistent SQL based multi-node systems. And even MySQL is frequently deployed with manual sharding on multi-nodes.

The products like Vitess (http://vitess.io/) proposes auto-sharding for MySQL, and with ProxySQL (which I will use in my experiment) you can setup a basic sharding schema.

I describe multi-nodes setups, because in this environment it is possible to achieve much better than linear scalability. I will show this below.

Why is this important?

Understanding scalability of multi-node systems is important for resource planning, and understanding how much of a potential performance gain we can expect when we add more nodes. This is especially interesting for cloud deployments.

How is it possible?

I’ve written about how the size of available memory (cache) affects the performance. When we add additional nodes to the deployment, effectively we increase not only CPU cores, but also the memory that comes with the node (and we are adding extra IO capacity). So, with increasing node counts, we also increase available memory (and cache). As we can see from these graphs, the effect of extra memory could be non-linear (and actually better than linear). Playing on this fact, we can achieve better-than-linear scaling in a sharded setup. I am going to show the experimental setup of how to achieve this.

Experimental setup

To show the sharded setup we will use ProxySQL in front of N MySQL servers (shards). We also will use sysbench with 60 tables (4 million rows each, uniform distribution).

  • For one shard, this shard contains all 60 tables
  • For two shards, each shard contains 30 tables each
  • For three shards, each shard contains 20 tables each
  • For six shards, each shard contains ten tables each

So schematically, it looks like this:

One shard:

Scaling

Two shards:

Scaling

Six shards:

Scaling

We want to measure how the performance (for both throughput and latency) changes when we go from 1 to 2, to 3, to 4, to 5 and to 6 shards.

For the single shard, I used a Google Cloud instance with eight virtual CPUs and 16GB of RAM, where 10GB is allocated for the innodb_buffer_pool_size.

The database size (for all 60 tables) is about 51GB for the data, and 7GB for indexes.

For this we will use a sysbench read-only uniform workload, and ProxySQL helps to perform query routing. We will use ProxySQL query rules, and set sharding as:

mysql -u admin -padmin -h 127.0.0.1 -P6032 -e "DELETE FROM mysql_query_rules"
shards=$1
for i in {1..60}
do
hg=$(( $i % $shards + 1))
mysql -u admin -padmin -h 127.0.0.1 -P6032 -e "INSERT INTO mysql_query_rules (rule_id,active,username,match_pattern,destination_hostgroup,apply) VALUES ($i,1,'root','sbtest$is',$hg,1);"
done
mysql -u admin -padmin -h 127.0.0.1 -P6032 -e "LOAD MYSQL QUERY RULES TO RUNTIME;"

Command line for sysbench 1.0.4:
sysbench oltp_read_only.lua --mysql-socket=/tmp/proxysql.sock --mysql-user=root --mysql-password=test --tables=60 --table-size=4000000 --threads=60 --report-interval=10 --time=900 --rand-type=pareto run

The results

Nodes Throughput Speedup vs. 1 node Latency, ms
1 245 1.00 244.88
2 682 2.78 87.95
3 1659 6.77 36.16
4 2748 11.22 21.83
5 3384 13.81 17.72
6 3514 14.34 17.07

Scaling
As we can see, the performance improves by a factor much better than just linearly.

With five nodes, the improvement is 13.81 times compared to the single node.

The 6th node does not add much benefit, as at this time data practically fits into memory (with five nodes, the total cache size is 50GB compared to the 51GB data size)

Factors that affects multi-node scaling

How can we model/predict the performance gain? There are multiple factors to take into account: the size of the active working set, the available memory size and (also importantly) the distribution of the access to the working set (with uniform distribution being the best case scenario, and with access to the one with only one row being the opposite corner-case, where speedup is impossible). Also we need to keep network speed in mind: if we come close to using all available network bandwidth, it will be impossible to get significant improvement.

Conclusion

In multi-node, auto-scaling, auto-sharding distributed systems, the traditional scalability models do not provide much help. We need to have a better framework to understand how multiple nodes affect performance.

Powered by WordPress | Theme: Aeros 2.0 by TheBuckmaker.com